The previous week I wrote about the importance of the big picture analysis. I did a long – term analysis on Gold using Weekly charts and Volume Profile.
You can read this analysis here:
GOLD – The Big Picture
Now, I would like to zoom in a bit and analyze Gold on a much lower time frame (30 Minute). This will point us to intraday supports/resistances which are currently there.
You can read this analysis here:
GOLD – The Big Picture
Now, I would like to zoom in a bit and analyze Gold on a much lower time frame (30 Minute). This will point us to intraday supports/resistances which are currently there.
Price Action analysis
Let’s first start with simple Price Action. Currently there is an uptrend on Gold. It looks like this: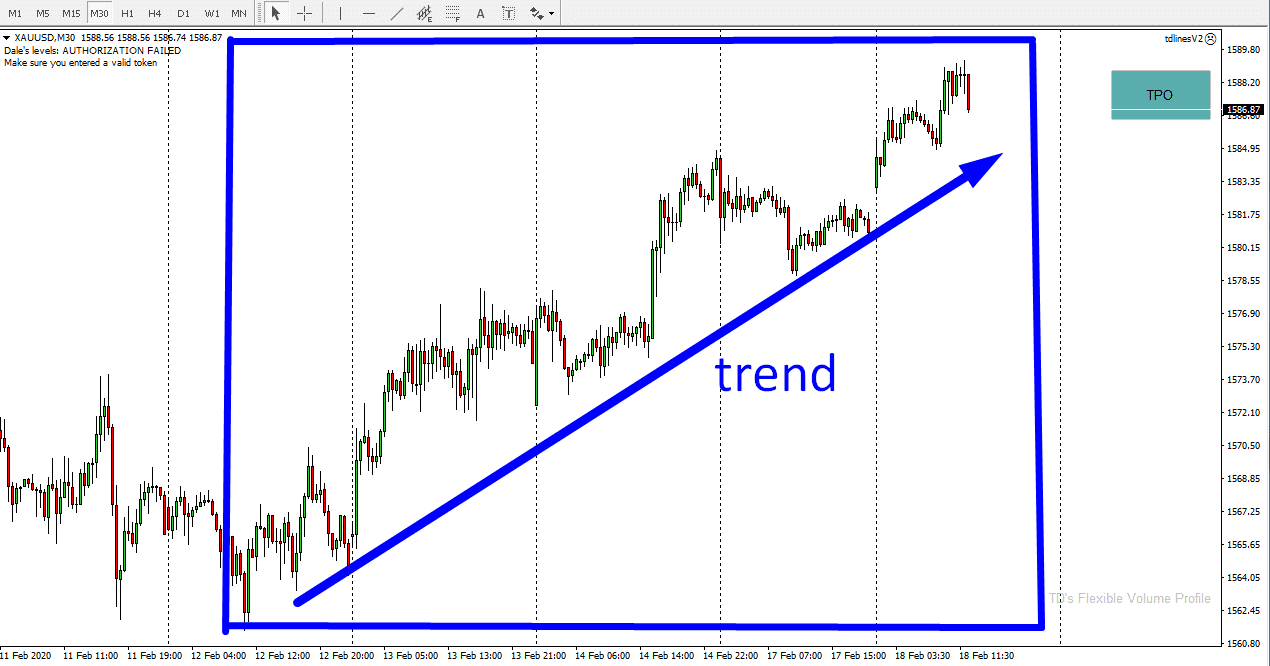
When there is a trend development like this, then I like to use my Flexible Volume Profile on the trend area. My goal is to see significant Volume Clusters which got accumulated in the trend.
Volume Cluster is an area, with heavy volumes. You should be able to spot them easily with Volume Profile. They should be visible at first sight. Nice and clean, that’s what we are looking for.
When there is a Volume Cluster (or more of them) created in a trend, then it means that heavy volumes got traded there.
In this case, there is an uptrend. Volume Cluster in an uptrend means this:
Buyers are pushing the price upwards and there are places, where those buyers were adding massively to their buying positions (that’s where we see Volume Clusters). Then they drive the price even higher.
Below, you can see the same chart as I have already shown you, but this time with Flexible Volume Profile.
XAU/USD; 30 Minute time frame:
Volume Clusters
What does a Volume Cluster in a trend mean?Volume Cluster is an area, with heavy volumes. You should be able to spot them easily with Volume Profile. They should be visible at first sight. Nice and clean, that’s what we are looking for.
When there is a Volume Cluster (or more of them) created in a trend, then it means that heavy volumes got traded there.
In this case, there is an uptrend. Volume Cluster in an uptrend means this:
Buyers are pushing the price upwards and there are places, where those buyers were adding massively to their buying positions (that’s where we see Volume Clusters). Then they drive the price even higher.
Below, you can see the same chart as I have already shown you, but this time with Flexible Volume Profile.
XAU/USD; 30 Minute time frame:
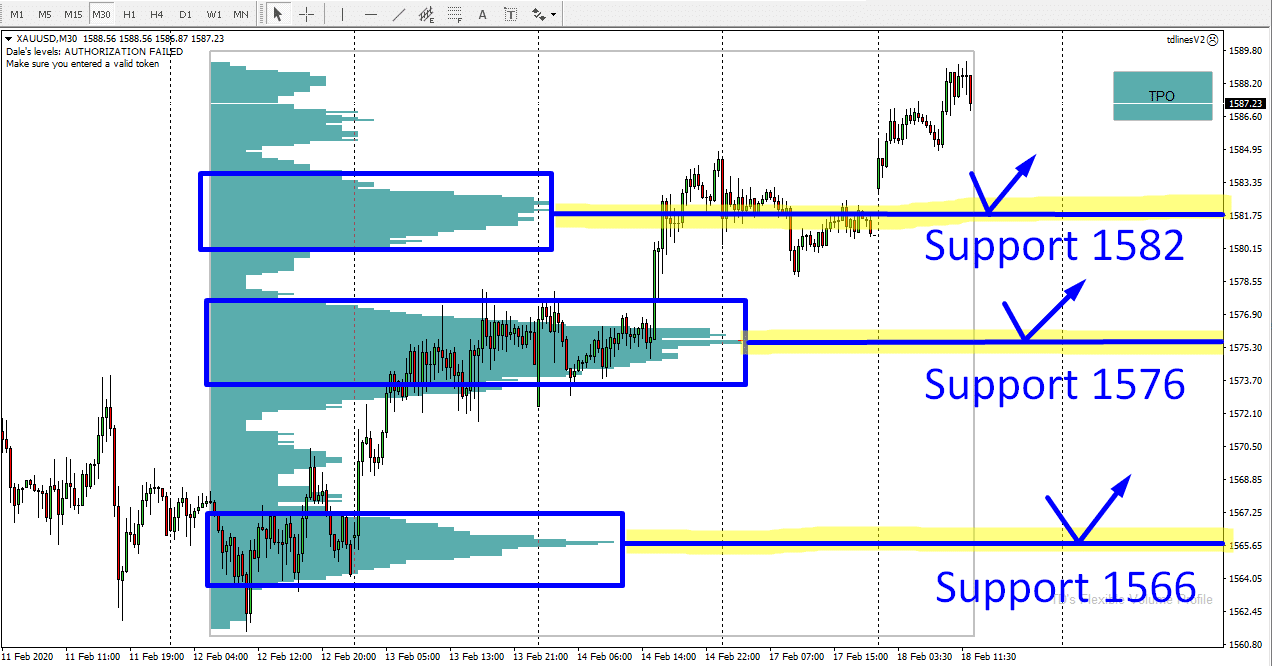
GOLD: Intraday Supports
In the picture, you can clearly see three significant Volume Clusters. Those were areas where buyers were entering most of their buying positions.What will happen when the price turns and makes it back to those three areas?
Chances are, that those buyers who were building up their buying positions there will become active again. They will try and defend those areas (defend their positions), and they will try to push the price upwards from those areas.
This is why those three Volume Clusters should work as significant (intraday) supports.
Does it matter when the price makes the pullback to those levels?
Well, in my experience markets have really good memory. So it does not matter that much.
Those three Volume Clusters should be strong Supports even after a few weeks after they got formed!
Happy trading!
-Dale
- Get link
- X
- Other Apps
- Get link
- X
- Other Apps
Comments
Post a Comment