The reality of trading is that there are not so many trades that would go exactly how you planned them.
If somebody tells you that market always does what he predicts and that there are no ugly situations, then I would not really trust such a guy…
Today, I am going to show you one pretty ugly trade which I had on USD/CAD.
This trade did not go as I planned it! At least not at first…
I would also like to show you how important is to stick to your strategy no matter what!
I published this level in my Member’s area a couple months in advance and since then we have been waiting for the price to hit it.
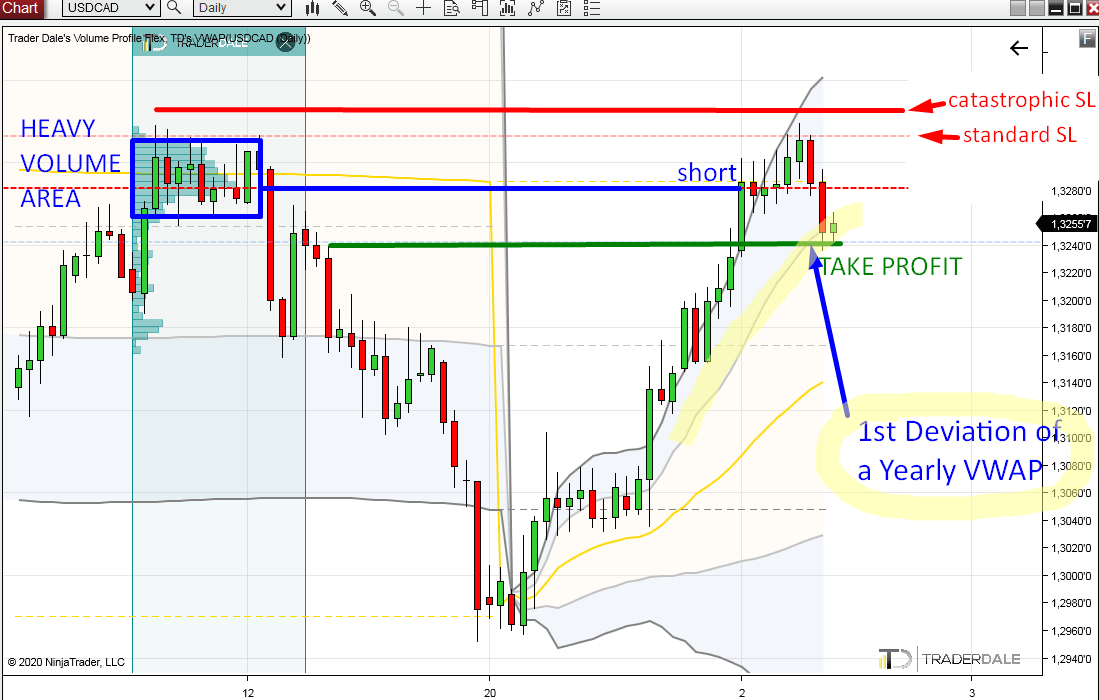
The short entry was based on Volume Accumulation Setup and it was at 1.3282. Standard SL was at 1.3321 and Take Profit at 1.3243.
I trade all my swing trades using the Alternative SL. This means that I do not close my swing trades unless a Daily candle closes past my Standard SL. This method also uses a hard Catastrophic SL (if price touches it, then I am out immediately).
*You can learn more about the Alternative SL here: Alternative SL
Below is a Daily chart of the USD/CAD where you can see what the level was based on and how it went.
If somebody tells you that market always does what he predicts and that there are no ugly situations, then I would not really trust such a guy…
Today, I am going to show you one pretty ugly trade which I had on USD/CAD.
This trade did not go as I planned it! At least not at first…
I would also like to show you how important is to stick to your strategy no matter what!
USD/CAD Swing short
The trade I am going to talk about is a swing short on USD/CAD.I published this level in my Member’s area a couple months in advance and since then we have been waiting for the price to hit it.
The short entry was based on Volume Accumulation Setup and it was at 1.3282. Standard SL was at 1.3321 and Take Profit at 1.3243.
I trade all my swing trades using the Alternative SL. This means that I do not close my swing trades unless a Daily candle closes past my Standard SL. This method also uses a hard Catastrophic SL (if price touches it, then I am out immediately).
*You can learn more about the Alternative SL here: Alternative SL
Below is a Daily chart of the USD/CAD where you can see what the level was based on and how it went.

As you can
see from the picture, the trade went pretty ugly. It did not react to
my short level (at first) and even the standard SL got hit!
In a situation like this it is very important to stick to your plan no matter what!
Let me now show you a detailed look how this trade went. I will demonstrate on a 30 Minute chart:
In a situation like this it is very important to stick to your plan no matter what!
Let me now show you a detailed look how this trade went. I will demonstrate on a 30 Minute chart:
Detailed look (30 Minute chart)
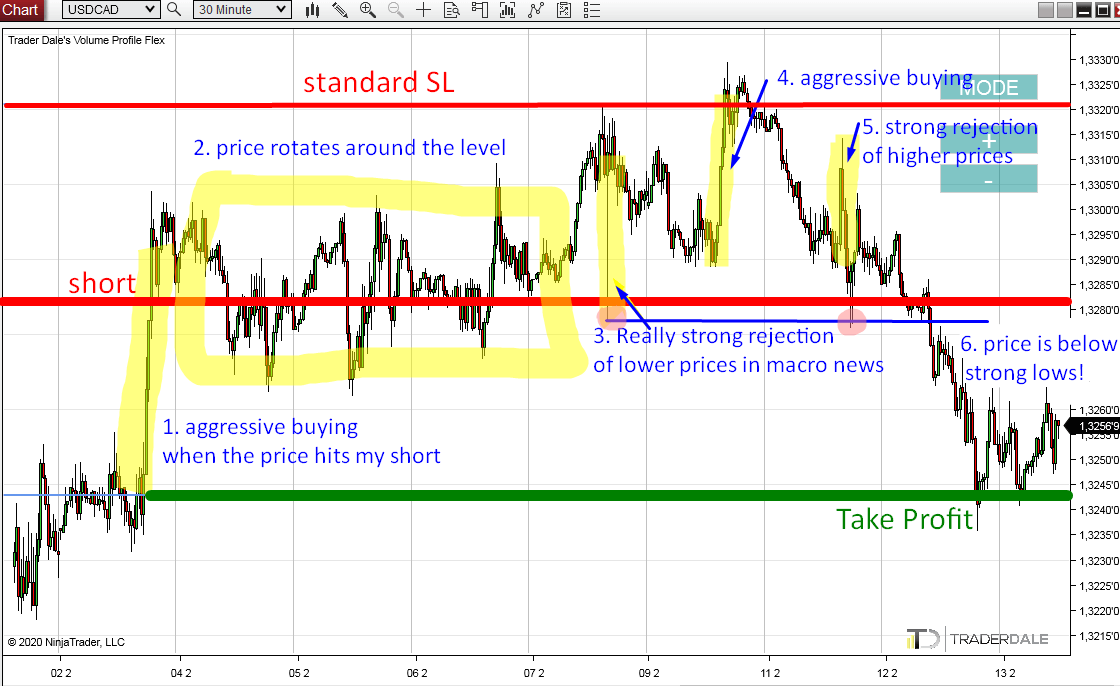
1. Before my short was hit, there was a strong buying activity showing aggressive buyers.
It is not really a good feeling to go short against such force, right?
But you gotta stick to the rules, so I went short as planned.
2. Then there was a rotation around my short level. I know that many people don’t like when the price does not react immediately to their level. But I don’t mind. In my experience, markets need their time. In fact I was happy that the strong buying stopped and I did not take an immediate Stop Loss.
3. This is when it all went sour! There was a crazy strong pin bar showing aggressive buyers (formed during macro news).
4. Next ugly thing after the pin bar was another strong buying activity. After this the price actually hit the standard SL! At that moment it seemed like almost 100% certainty that this trade would be a loser.
Despite all this I held my position according to the rules. Daily candle still did not close above the standard SL! You gotta stick to the rules 🙂
5. The first positive thing was when this strong rejection of higher prices occurred. Sellers are back! Hooray!
6. When the price went below two strong lows (highlighted in red) I knew we were heading for the Take Profit!
Finally, after 11 days!
What I wanted to show you with this is how important it is to stick to your rules, no matter what happens. Pro traders don’t change their rules in the spur of the moment or based on their emotions.
Next time some trade looks ugly and you want to break your rules, remember this trade, okay?
BONUS: VWAP as Take Profit
There is one more little thing I wanted to share with you here.If you look at the Daily chart again, then you can see how the Take Profit nicely aligns with 1st Deviation of Yearly VWAP.
This 1st Deviation indicates a possible price reversal there (Trend VWAP setup I teach in the VWAP Video Course).
That’s what I call a good place to quit a short trade!
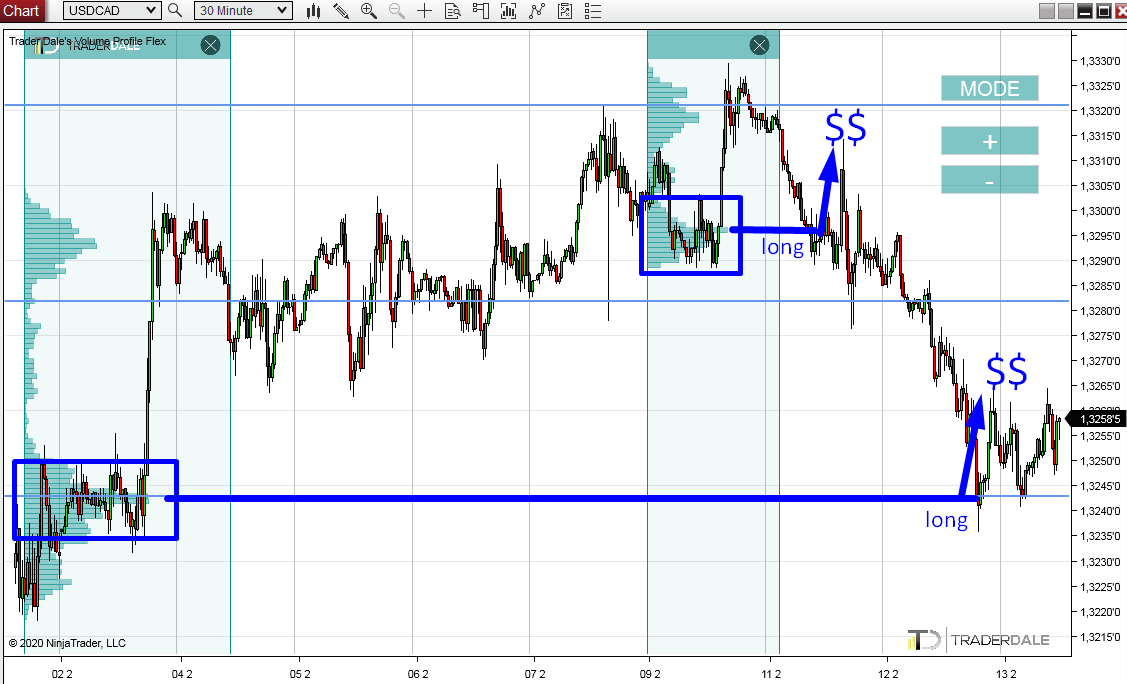
Intraday longs along the way!
By the way, I grabbed two nice intraday trades during this swing trade.Funny thing is that despite I was short with my swing trade, those intraday trades were longs!
Below are the two intraday longs. The second one was actually at the swing trade Take Profit!
Both longs were also published in advance for members of my Trading course.
USD/CAD; 30 Minute chart:
I hope you guys found this interesting! Feel free to leave a comment below and let me know what you think!
Happy trading!
-Dale
-Dale
- Get link
- X
- Other Apps
- Get link
- X
- Other Apps
Comments
Post a Comment