There is now a lot of attention on the AUD/USD. The reason for this is that it has just hit it’s 11 year low!
There are fundamental reasons for this (fires, Coronavirus,…) but I don’t really believe the AUD can fall indefinitely. Sooner or later it will bottom out and I think this moment is coming!
If you load enough of historical data, then chances are that you will find out that the price actually was as low or even lower at some point in the past.
There are fundamental reasons for this (fires, Coronavirus,…) but I don’t really believe the AUD can fall indefinitely. Sooner or later it will bottom out and I think this moment is coming!
Look back in the past
When a trading instrument falls to its multi-year lows and you want to look for a place where it could bottom out, then it is best to load some historical data and check out if the price was as low or lower in the past.If you load enough of historical data, then chances are that you will find out that the price actually was as low or even lower at some point in the past.
Check out the volumes
The next thing you want to do is to use Volume Profile tool to look into volumes and their distribution. The important thing is how the volumes were distributed in the past, when the price was as low as it is now.When you do this, you may be able to identify a strong Support which would mark a place where the price could stop falling and reverse.
I did just that on the Monthly chart of AUD/USD:
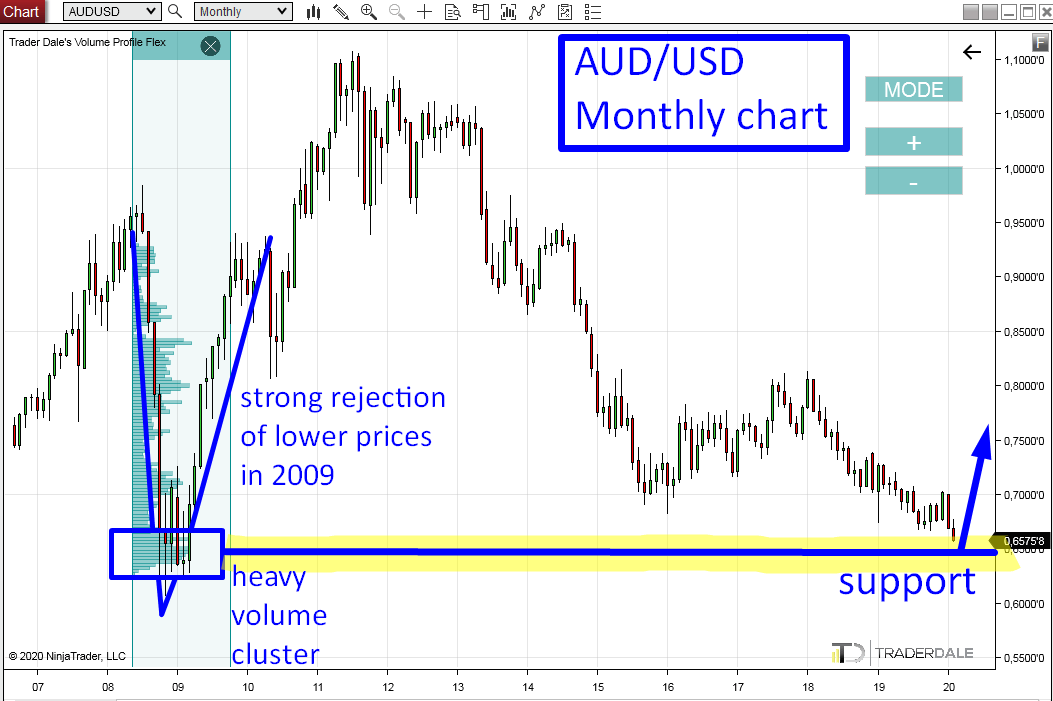
AUD/USD Monthly chart analysis
In the chart above you can see that the price is now hitting an area where it already was in 2009.The first thing that should get your attention should be the strong rejection of lower prices (in 2009). I marked it in the chart.
This rejection tells us that the price was falling rapidly. There were three months of crazy selling. Then the price turned and went into a crazy uptrend.
This means that sellers were pushing the price downwards but then very strong buyers came in and with massive force and aggression started a new uptrend.
You can learn more about the Rejection setup here:
Rejection setup explained
Volume Profile analysis
If you look into the volume distribution in this rejection area from 2019, then you can see that there was a significant Volume Cluster created around 0.6500.This Volume Cluster points us to the place where the buyers who turned the price in 2009 placed lots of their buying positions. For them, this is the most important place in this whole rejection!
As you can see, currently the price is getting into this area again. Will those buyers from 2009 still be there defending their positions? I think they will!
I know it is over 11 years, but strong volume zones like this one don’t just get forgotten. Markets have good memory!
What happens now?
Now I
think the chances are that the downtrend will stop and possibly turn.
Price is approaching a strong volume area which will most likely be
defended by strong buyers. Those buyers will try to push the price
upwards again.
Remember that this is a Monthly chart, so this may not happen today or tomorrow! It could take a few months! With trades like this patience is the key!
Remember that this is a Monthly chart, so this may not happen today or tomorrow! It could take a few months! With trades like this patience is the key!
Check out the Swap!
If you are into trading such long-term trades as this one then there is one thing you should always consider before entering your position! The thing is Swap.Swap is a payment you will pay (or sometimes receive) when you hold any forex position overnight.
If you trade on Monthly charts it is possible that you will hold your position for many weeks or months! Every day you will pay (or receive) Swap.
IMPORTANT: Every broker has a different Swap!
My advice is that before opening a long-term position you check your brokers website and see what is the swap you will pay or receive. There should be a table that will look like this:
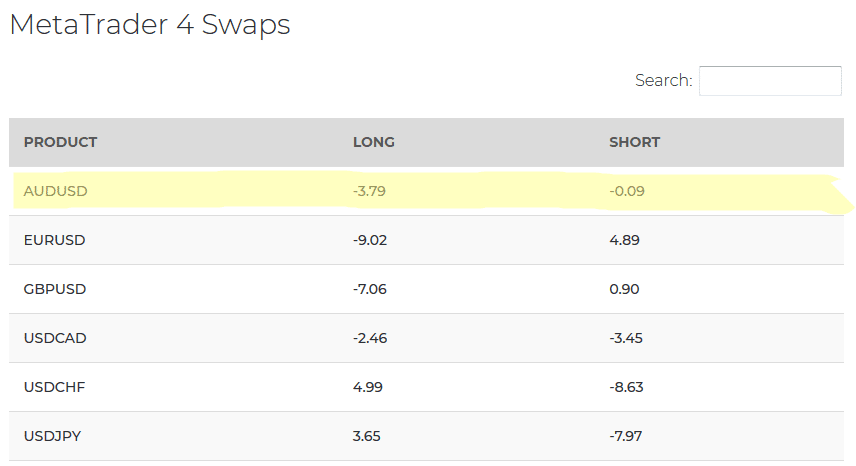
In this table you should be able to see the trading instrument you want to trade and Swap for Long and Short positions.
In this example, you would pay $3.79 (per lot) every day you hold a Long on AUD/USD and $0.09 if you hold a short.
Ideal scenario is when the Swap is positive and you actually receive money for holding your position.
This was for example the case of a short on EUR/USD I held over a year. Apart from +1.600 pip profit I was also getting a positive Swap every day. Because I held the trade over a year, the positive Swap increased my profit from this trade by 20%.
I wrote more about this EUR/USD trade here:
EUR/USD short trade: Prediction
EUR/USD short trade: Commentary
I hope you guys liked today’s article. Let me know what you think in the comments section below!
Happy trading!
-Dale
-Dale
- Get link
- X
- Other Apps
- Get link
- X
- Other Apps
Hey, thanks for the information. your posts are informative and useful.
ReplyDeleteJtekt India