Today, I am going to do a swing trade analysis of CHF/JPY forex pair. I usually do swing trade analysis on a Daily time frame. This time frame helps me to see the big picture (which is needed for swing trading).
When I see a strong trend like this I use my Flexible Volume Profile tool and I look into the trend area.
What I want to see there, is a nicely visible Volume Cluster. In such a Volume Cluster, volumes are accumulated.
If there is an uptrend, then it means, that buyers were adding to their positions there (in this Volume Cluster).
When the price returns back to this Volume Cluster, then it usually works as a support/resistance.
Trend Setup on CHF/JPY
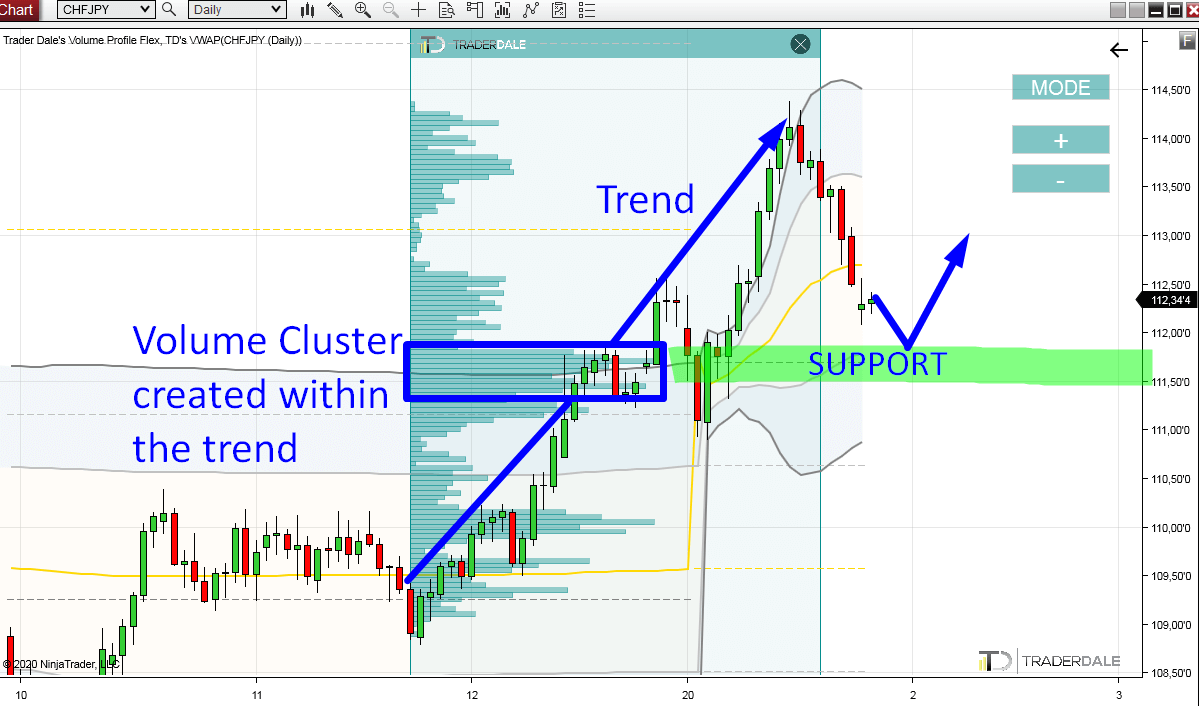
The CHF/JPY was in a trend since the end of November 2019. Strong buyers were pushing the price upwards.When I see a strong trend like this I use my Flexible Volume Profile tool and I look into the trend area.
What I want to see there, is a nicely visible Volume Cluster. In such a Volume Cluster, volumes are accumulated.
If there is an uptrend, then it means, that buyers were adding to their positions there (in this Volume Cluster).
When the price returns back to this Volume Cluster, then it usually works as a support/resistance.
This is the case of the CHF/JPY.
Strong uptrend with nice Volume Cluster in the middle. When the price makes it back to this level again, then this Volume Cluster should work as a Support.
Why? Because the buyers who were pushing the price upwards and who were adding to their volumes there (in the Volume Cluster), will be defending their positions. So, when the price makes it back to this area, they will start aggressively buying and they will try to push the price upwards again.
You can see this on a picture below. The Support is marked around 111.70 area.
Resistance → Support Confirmation
So, now we have a Volume-based support. Is there anything else that would support this trading idea? You bet there is! My favorite confirmation Support becoming a Resistance (and vice versa) setup!The price very nicely reacted to this level in the past. You can see it if you zoom out the chart a bit (we are still on the Daily chart):
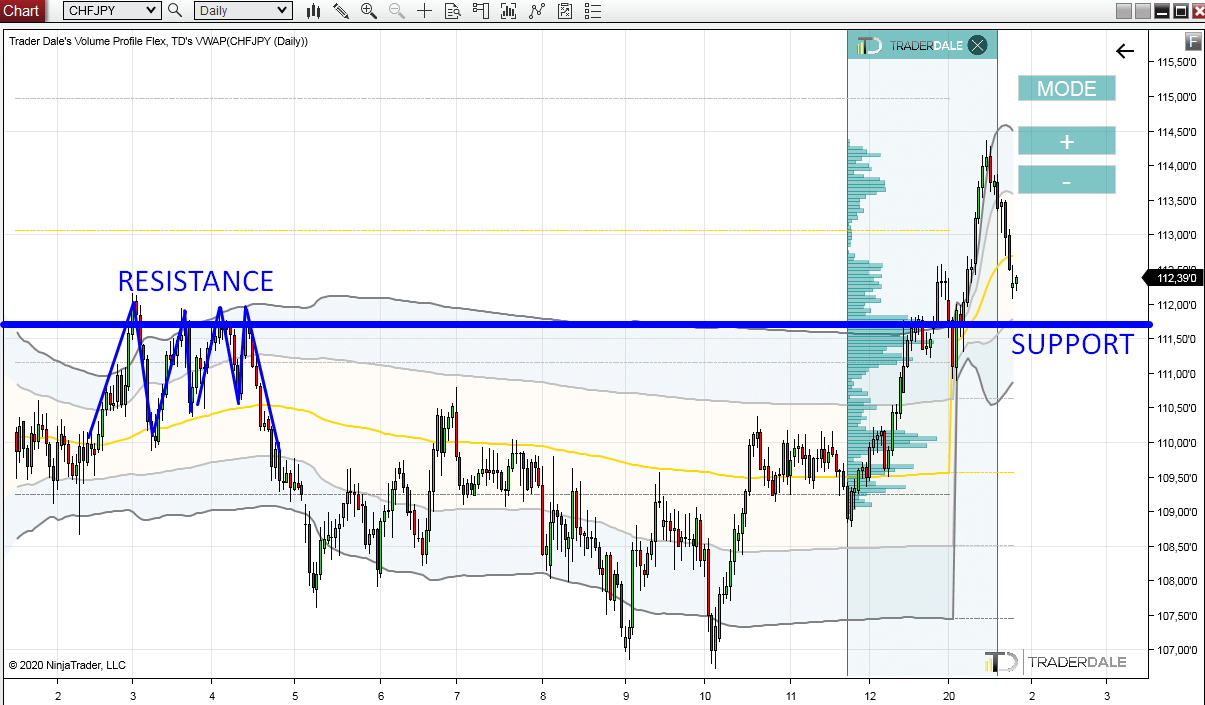
This means, that the level was a strong Resistance. When the price went past the Resistance, it then turned into a Support.
The cool thing about this is that this Support is at our Volume-based level (around 111.70)!
The cool thing about this is that this Support is at our Volume-based level (around 111.70)!
VWAP 1st Deviation
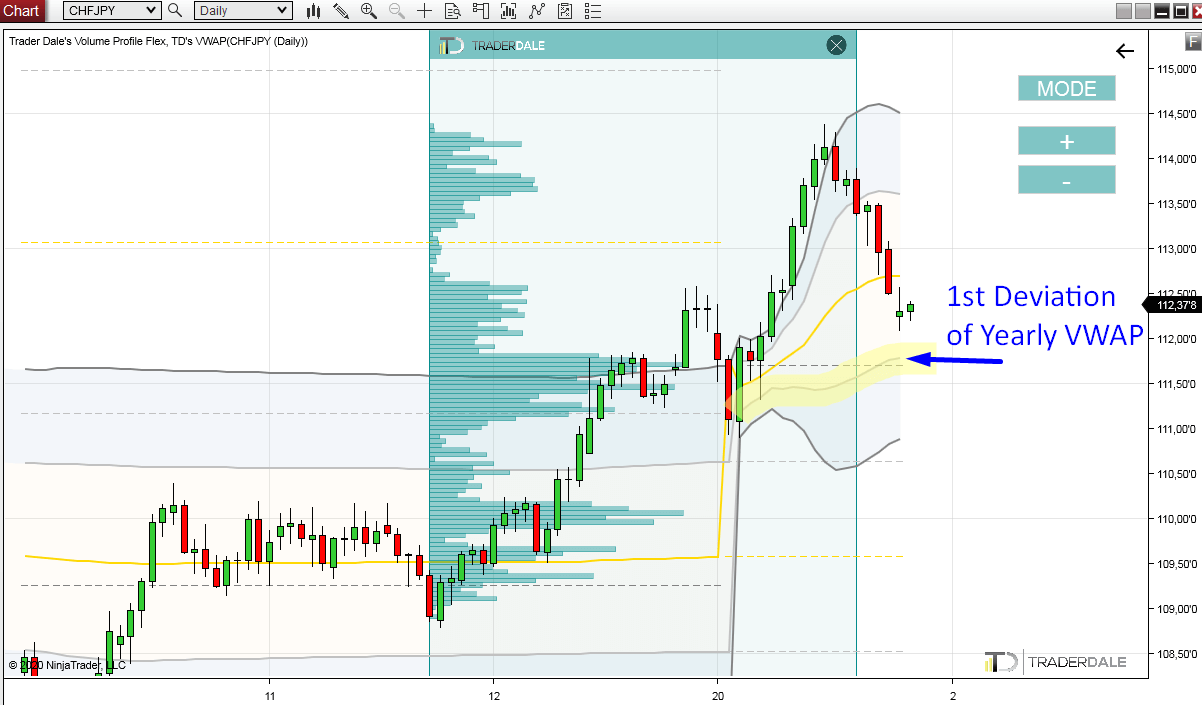
There is even more! One more confluence/confirmation I was able to find.It is the Yearly VWAP. More precisely the 1st Deviation of the Yearly VWAP!
What’s that? It is the grey line (I highlighted it in yellow) which is slowly developing since the start of the year.
It is moving and developing, but right now, it is very close to our Volume-based Support zone.
1st Deviation of VWAP often works as a Support/Resistance itself alone. But when it meets with Volume-based level, then it is even nicer confirmation of the strength of the level.
Want to learn more about the VWAP? Then watch this short video:
VWAP introduction video
One Risky Thing About This
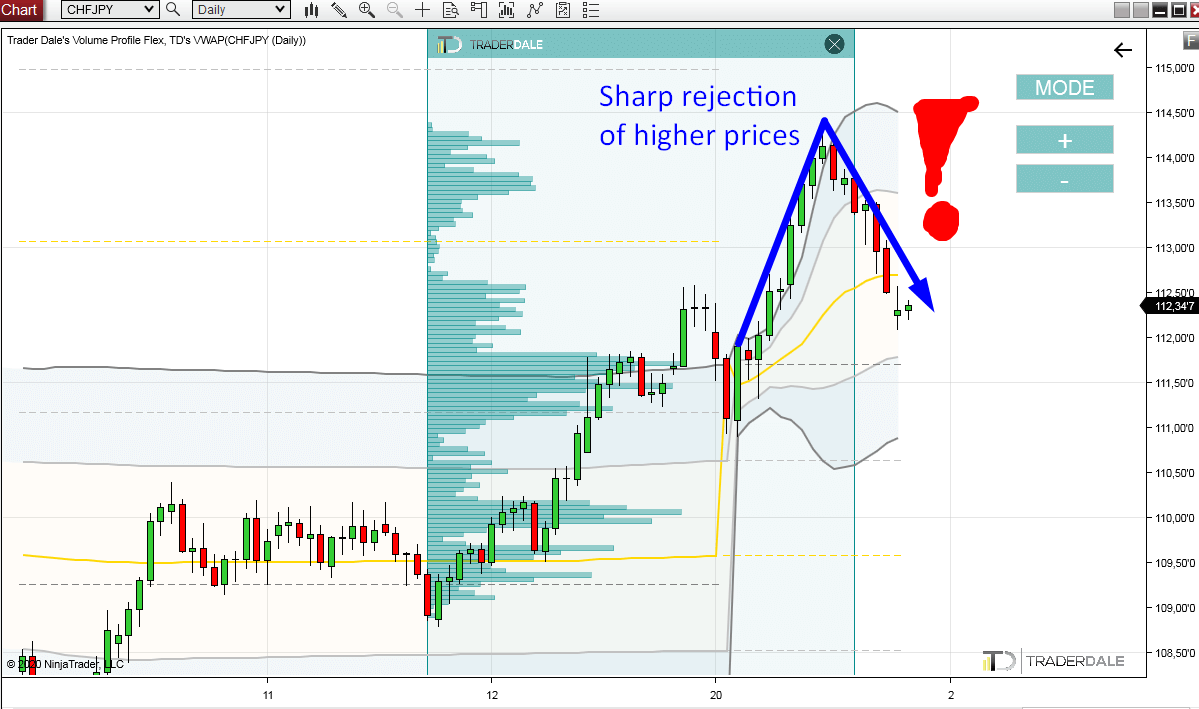
There is one thing which is a bit risky with this Support zone (I said it many times, there is no best, zero-risk trade).The thing is how strongly the price turned a few days back, and also how strongly and aggressively it now moves downwards.
This is a sign of strong sellers. After those 2 months of an uptrend, it seems that sellers took over (at least for now).
The question is: Who will be stronger when the price reaches the Support zone? The sellers who are currently pushing the price downwards? Or the buyers from the uptrend who will be defending their buying positions?
In my opinion, it will be the buyers who will be stronger in the end. The level seems pretty strong and we have two nice confluences to support it.
Why the JPY Strengthens? – Fundamentals
If you are curious, why the JPY is getting stronger, then it is because of an uncertainty, or threat. JPY almost always reacts to uncertainty or a threat like this.Currently, the uncertainty/threat seems to be the Coronavirus, and the rockets hitting US embassy in Baghdad.
Strengthening of JPY is the initial reaction, but when this passes, it can as easily weaken back again.
Happy trading!
-Dale
-Dale
- Get link
- X
- Other Apps
- Get link
- X
- Other Apps
Thanks for sharing valuable information.
ReplyDeleteKaveri Seed Company Ltd
Brigade Enterprises Ltd