In a Weekly Ideas video, which I posted here on Monday, I was talking about gaps that got created on the market open on Monday.
In this post, I would like to follow up on this video and talk more about the gaps and most importantly about one cool trading setup!
Unlike for some other trading instruments (for example stocks) gaps are pretty rare on forex. Forex runs 24/5 so, the only time they can occur is when the market opens on Monday.
If it is news-related and the gap is bigger, then it can stay not filled longer. Usually, max a few days. Then in most cases, the gap gets filled.
If there are heavy volumes created before the gap, then the heavy volume area will work as a strong Support/Resistance.
What you want to see is this:
1. Opening gap
2. Heavy volumes before the gap
3. Price fills the gap and then hits the heavy volume area – which is the Support/Resistance. You enter your trade from there
Let’s now have a look at few examples I published there and let’s see how price already reacted to some of them.
In this post, I would like to follow up on this video and talk more about the gaps and most importantly about one cool trading setup!
Unlike for some other trading instruments (for example stocks) gaps are pretty rare on forex. Forex runs 24/5 so, the only time they can occur is when the market opens on Monday.
Gaps Tend to Get Filled
On forex, gaps tend to get filled. If there is a small gap and no major news that would have caused it, then the gap gets usually filled pretty soon (in a matter of hours).If it is news-related and the gap is bigger, then it can stay not filled longer. Usually, max a few days. Then in most cases, the gap gets filled.
Gap Trading Setup – Explained
There is a nice trading setup you can trade when there is an opening gap.If there are heavy volumes created before the gap, then the heavy volume area will work as a strong Support/Resistance.
What you want to see is this:
1. Opening gap
2. Heavy volumes before the gap
3. Price fills the gap and then hits the heavy volume area – which is the Support/Resistance. You enter your trade from there
Examples
In the Weekly Trading ideas video and also in my member’s area (members of Dale’s Trading course), I published some trading levels based on the opening gap which occurred on JPY forex pairs.Let’s now have a look at few examples I published there and let’s see how price already reacted to some of them.
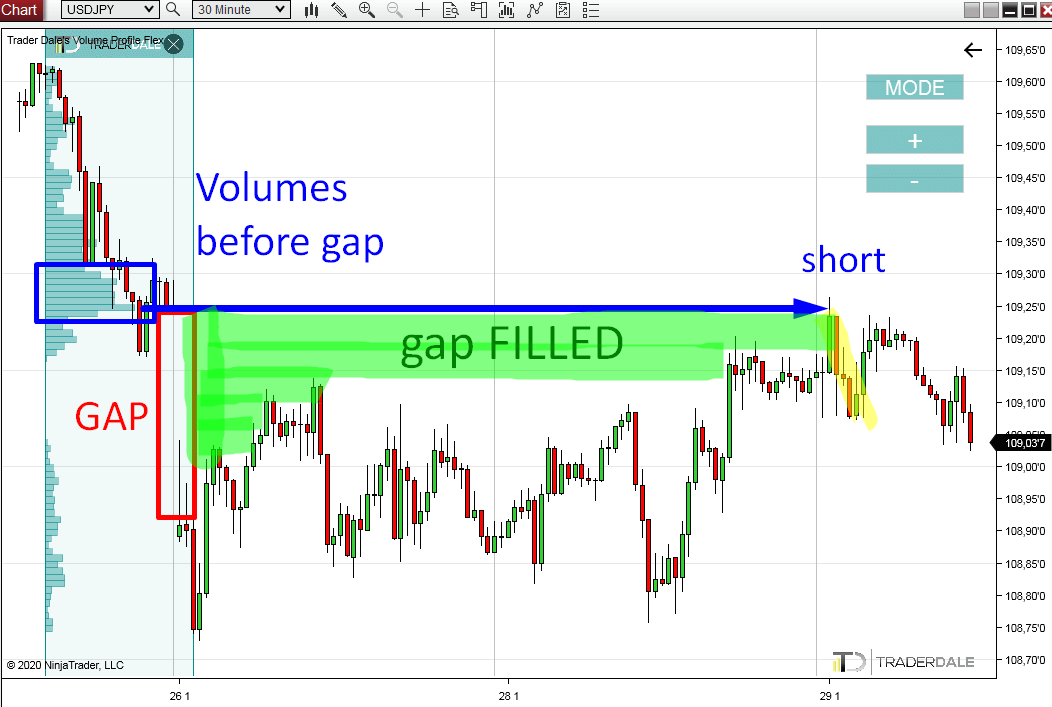
USD/JPY Gap Example
Let’s start with USD/JPY.There was an opening gap and it got fully filled in today’s asian session. There was a nice Volume cluster created before the gap on Friday (marked in blue rectangle).
So, gap got closed, price hit heavy volumes, filled my short pending order and went quickly downwards. A perfect trade!
The chart below is USD/JPY; 30 Minute Time frame.
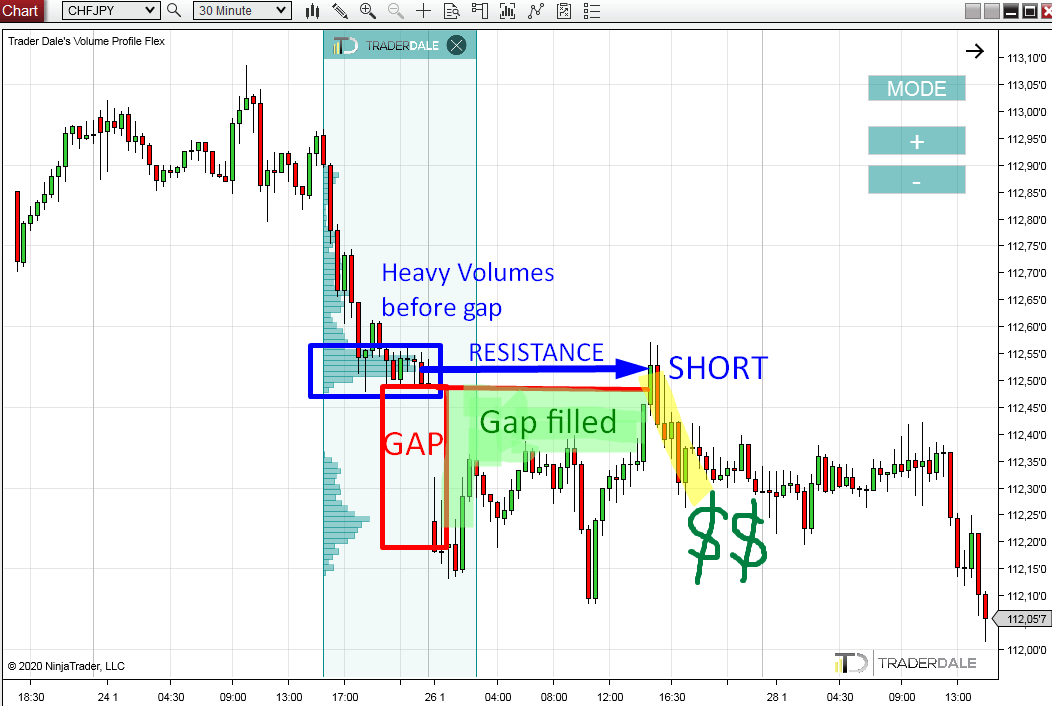
CHF/JPY Gap Example
Another trade based on this setup was on CHF/JPY.The scenario was the same as in the previous case. There was an opening gap and heavy volumes got created before it.
Those volumes were a strong Resistance. The gap completely closed on Monday and then the price reacted to the heavy volumes.
Another nice profit! BTW I published this trading level in the Weekly trading ideas video in advance on Monday. You can watch the video here:
Trading the Opening Gap on JPY Forex Pairs – Weekly Trading Ideas
The chart below is CHF/JPY; 30 Minute Time frame.
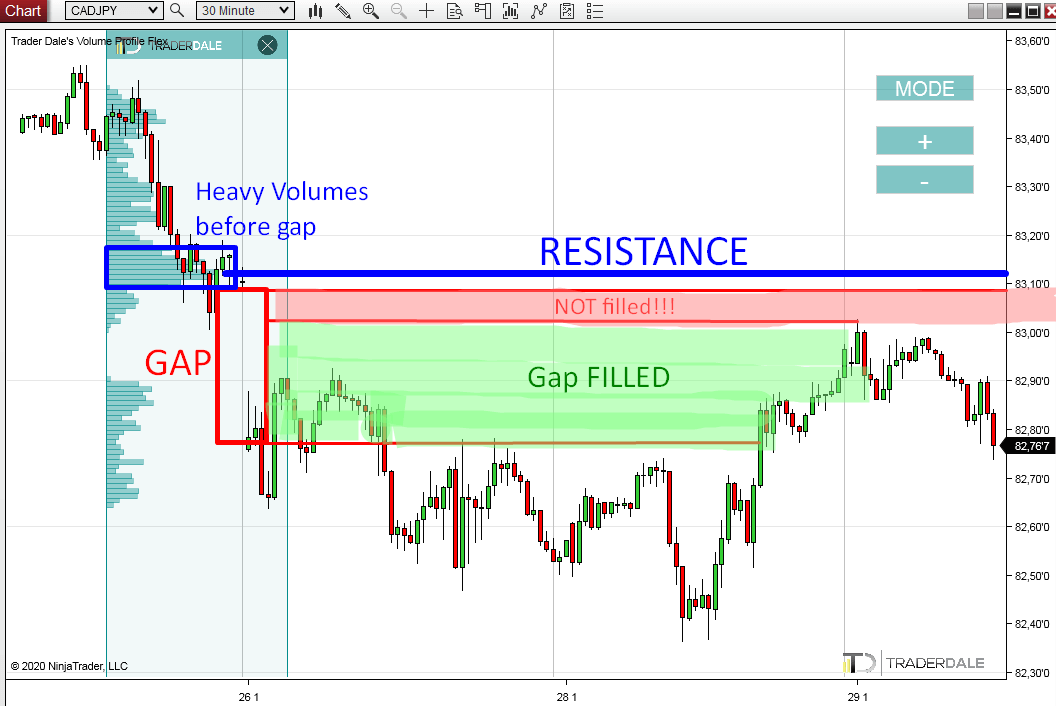
CAD/JPY Gap Example
Now, there are still some JPY pairs, that haven’t closed the gap yet! Let’s first have a look at the CAD/JPY.This pair closed the gap only partly. The way I look at it, is that the gap still is not properly closed and therefore I consider it a standard gap, which will need to get closed eventually.
In the picture I divided the gap into two parts. The first – green part already got filled. The red part is still not filled.
The resistance based on the heavy volumes before the gap is a little bit above the gap.
What I expect is that the price will eventually fully close the gap (the red area) and then react to the resistance I marked in blue.
The chart below is CAD/JPY; 30 Minute Time frame.
AUD/JPY – What if the gap does not get filled?
The last example is on the AUD/JPY.In here, the gap did not get filled at all. It has already been two and a half days and still nothing!
I still expect this gap to get closed soon. My guess is that it will be filled until this week ends.
If it does not get filled and if it stays this way, then the market could go into a downtrend.
This is actually another phenomenon I wanted to show you!
If there is a gap which is not filled, then it means that one side of the market (buyers or sellers) is clearly much stronger than the other and they will push the price one way only – away from the gap.
In other words – market participants don’t even have the strength to push the price towards the gap to close it.
This in many cases starts a strong trend.
AUD/JPY Example
If the gap in the picture below does not get closed within the next couple of days, then it is likely that it will not get closed at all and a strong downtrend will start.The chart below is AUD/JPY; 30 Minute Time frame.

I hope you guys found this useful! Feel free to let me know what you think in the comments below!
Happy trading!
-Dale
Happy trading!
-Dale
- Get link
- X
- Other Apps
- Get link
- X
- Other Apps
Thanks for sharing valuable information
ReplyDeleteShriram Transport Finance Co. Ltd
Oberoi Realty Ltd