ECB Macro News
The biggest thing yesterday was without any doubt the ECB Meeting and the following Press Conference.It was not only important from the fundamental standpoint, but also because it helped EUR/USD to break out of a price channel and travel quickly downwards.
Before the ECB macro news came out, the price was in rotation. What do you think happened in this rotation?
In my opinion, the big guys were building up their selling positions there and then when the ECB event came up, they started aggressive selling activity to push the price downwards.
Use Volume Profile after the news – Volume Accumulation Setup
So, the best thing you can do in such a situation is to use my Flexible Volume Profile and look into the rotation area to see how the volumes were distributed there and where exactly the volumes were the heaviest (this place is called Point of Control = POC).Why? Because at POC, the big guys (big financial institutions) placed most of their volumes (positions). Those guys will try and defend those positions in the future. For this reason this level should work as a resistance.
Check it out below, on the EUR/USD 30-Minute chart:

In the picture, you can see that there were indeed pretty heavy volumes accumulated before the sell-off.
POC of the rotation before the start of the selling was at 1.1087.
This is the place the big guys placed most of their positions and this is the place they will defend.
For this reason 1.1087 should work as a strong RESISTANCE.
Btw this setup is called Volume Accumulation Setup and you can learn more about it for example in this free webinar:
Volume Profile Webinar
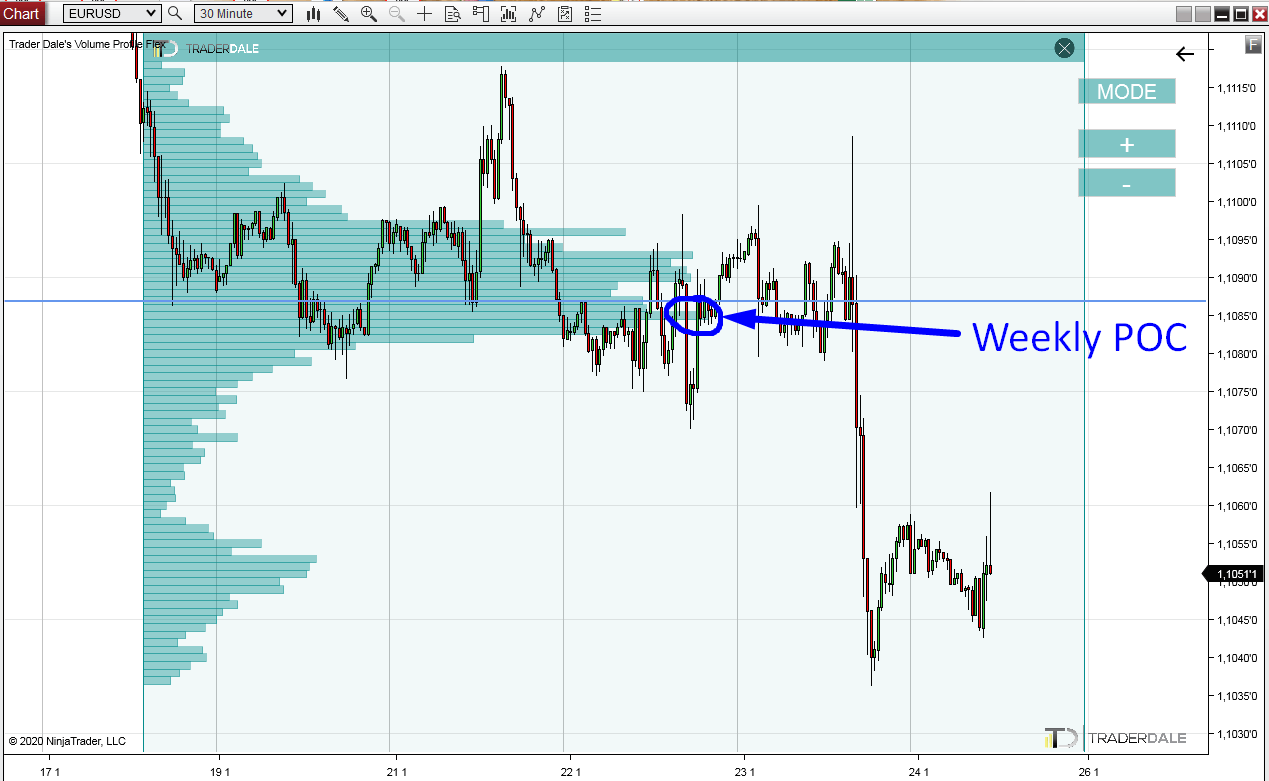
1st confirmation – Weekly POC
If you look at how price was moving this whole week, then you can notice, that it was more or less in a rotation.You may have learned from my book, then when there is a rotation big guys are building up their positions.
BTW you can get my book here just for $4.99:
Volume Profile: The Insider’s Guide to Trading
So, this whole week big guys were accumulating their trading positions. Most likely short positions (because they pushed the price downwards yesterday).
If you use my Volume Profile in this whole rotation, then Point of Control (heaviest volumes throughout this whole week) was just 2 pips below the 1.1087 RESISTANCE!
That’s the kind of trade confirmation I like to see!
Chart below shows again the EUR/USD, 30-Minute chart:
2nd Confirmation – SUPPORT becoming RESISTANCE Setup
Apart from the weekly POC, there is also one more confirmation to this level.It is the SUPPORT becoming RESISTANCE setup.
More about this setup here:
SUPPORT becoming RESISTANCE setup explained
Two weeks ago, the price bounced very nicely off this level. This tells me, that it was a strong SUPPORT.
This whole week the price was rotating around this level and finally yesterday it broke through the level and the former SUPPORT became a RESISTANCE.
Check it out on this zoomed-out EUR/USD, 30 Minute chart:

So, all in all we have:
RESISTANCE level based on Volume Accumulation setup, and confirmed by Weekly POC and SUPPORT becoming RESISTANCE setups.
In this game, the winner is whoever is able to guess 6 out of 10 cases right. If you can do this in the long run, then you are a real master.
So, yeah. This level does looks good and I like it, but I am not going to get crazy with trading it. I will trade it with the same rules as any other trade.
In my opinion, this trade has higher than 60% probability of success, but it is definitely not 100%
Important thing is that you don’t get crazy about any trade you like. Even the best looking trading levels can fail and you don’t want to be betting too much on them!
Thanks for reading this and have a GREAT weekend!
-Dale
RESISTANCE level based on Volume Accumulation setup, and confirmed by Weekly POC and SUPPORT becoming RESISTANCE setups.
Never get too crazy about one trade!
Is this the best level ever and 100% sure to work? No it is not! Not even the best looking levels have 100% probability of success.In this game, the winner is whoever is able to guess 6 out of 10 cases right. If you can do this in the long run, then you are a real master.
So, yeah. This level does looks good and I like it, but I am not going to get crazy with trading it. I will trade it with the same rules as any other trade.
In my opinion, this trade has higher than 60% probability of success, but it is definitely not 100%
Important thing is that you don’t get crazy about any trade you like. Even the best looking trading levels can fail and you don’t want to be betting too much on them!
Thanks for reading this and have a GREAT weekend!
-Dale
- Get link
- X
- Other Apps
- Get link
- X
- Other Apps
Hey, thanks for the information. your posts are informative and useful.
ReplyDeleteKeerthi Industries