In
yesterday’s post I was talking about an intraday trading setup which you
can use when market opens with a gap. If you missed it, then you can
read it here:
Gap Trading Setup
Today, I would like to have a look at more long-term analysis which can be used for planning your swing trades.
Today, I will analyze the AUD/JPY and I will use a Daily chart. Daily charts are my favorite for making swing trade analysis.
There were some pretty strong and aggressive rejections of lower prices. Two rejections were around 73.75 and one a bit lower, around 73.35.
When the price bounces off a level like this, then it means that the level was a strong Support or Resistance. In this case a Support.
It is always a good idea to watch how market reacts to such zones in the future.
Right now, the price is going aggressively downwards. A strong downtrend has started. In this downtrend, sellers dominate the market and the price just blew past those old Supports.
BTW if you would like to know how you could have predicted this downtrend, then check this out:
What happens when opening gap does not get filled?
In the picture below, you can see the Price Action analysis. It shows AUD/JPY; Daily chart.
Gap Trading Setup
Today, I would like to have a look at more long-term analysis which can be used for planning your swing trades.
Swing trading vs. Intraday trading
If I had to choose between intraday trading and swing trading, then my choice would be swing trading. The reason is that swing trading it is less time consuming, there are lower chances for you to make some sort of mistake, and also all kinds of trading instruments really nicely react to higher time frames (like Daily).Today, I will analyze the AUD/JPY and I will use a Daily chart. Daily charts are my favorite for making swing trade analysis.
Price Action Analysis
Let’s first start with a simple Price Action analysis.There were some pretty strong and aggressive rejections of lower prices. Two rejections were around 73.75 and one a bit lower, around 73.35.
When the price bounces off a level like this, then it means that the level was a strong Support or Resistance. In this case a Support.
It is always a good idea to watch how market reacts to such zones in the future.
Right now, the price is going aggressively downwards. A strong downtrend has started. In this downtrend, sellers dominate the market and the price just blew past those old Supports.
BTW if you would like to know how you could have predicted this downtrend, then check this out:
What happens when opening gap does not get filled?
In the picture below, you can see the Price Action analysis. It shows AUD/JPY; Daily chart.

Volume Profile Analysis
So, what next?In situation like this, I search for new Supports where the price could stop and turn it’s direction.
I search for those new Supports using the Volume Profile tool.
Essentially, I look for heavy volumes which are standing in the way – like in the picture below.
It is the same picture as before, only this time it is with Flexible Volume Profiles.
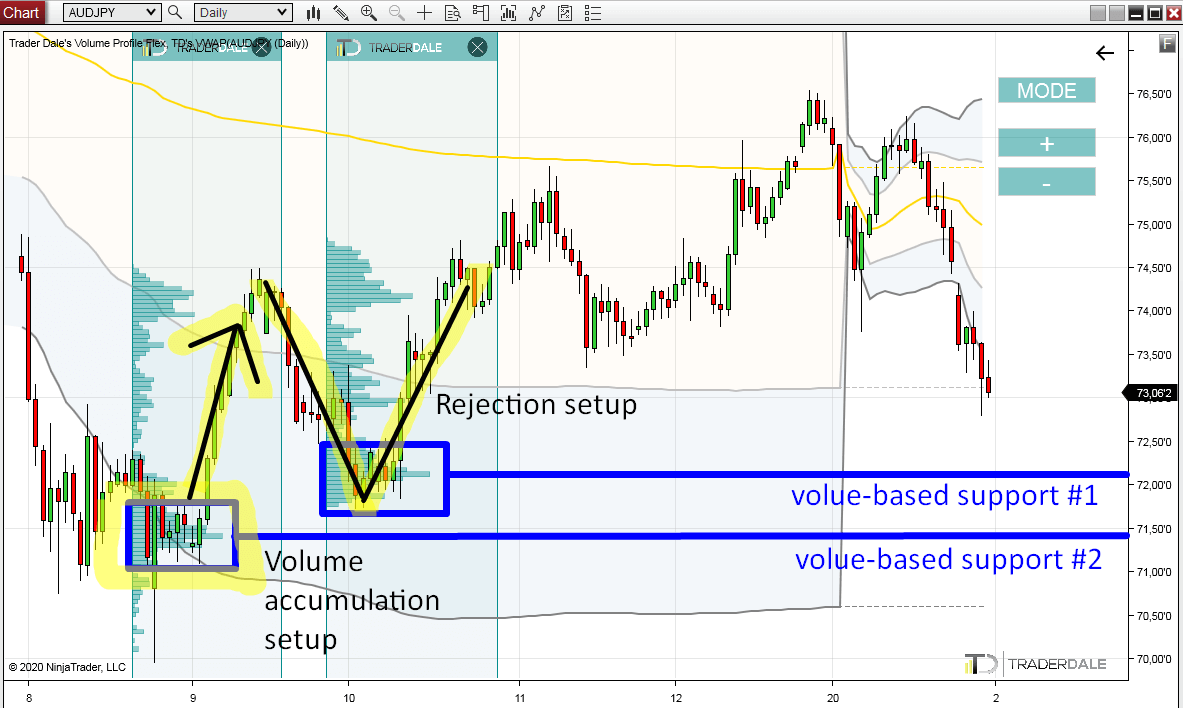
What you see in the picture are two heavy volume areas. First around 72.15, and the second around 71.40.
There was a strong rejection of lower prices. Buyers took over, and pushed the price upwards.
There was a heavy volume cluster created within the rejection. In this area, the buyers who turned the price aggressively upwards, placed most of their buying positions.
This will be the place the buyers will defend when the price makes it into this area again (around 72.15). This means it is likely to work as a Support.
There was a rotation which was followed by strong buying activity (marked with the black arrow).
In this rotation, buyers were accumulating their buying positions. When they were done with this, they aggressively pushed the price upwards. The Volume cluster I marked in the yellow-blue rectangle is the place, where they placed most of their positions (volumes were the heaviest there).
When the price makes it back to this area again, then those buyers are likely to become active again and try to push the price upwards again. This means this area should work as a Support.
Rejection Setup (Support #1)
The first Support is based on a Rejection Setup.There was a strong rejection of lower prices. Buyers took over, and pushed the price upwards.
There was a heavy volume cluster created within the rejection. In this area, the buyers who turned the price aggressively upwards, placed most of their buying positions.
This will be the place the buyers will defend when the price makes it into this area again (around 72.15). This means it is likely to work as a Support.
Volume Accumulation Setup (Support #2)
The second Support (71.40) is based on the Volume Accumulation Setup.There was a rotation which was followed by strong buying activity (marked with the black arrow).
In this rotation, buyers were accumulating their buying positions. When they were done with this, they aggressively pushed the price upwards. The Volume cluster I marked in the yellow-blue rectangle is the place, where they placed most of their positions (volumes were the heaviest there).
When the price makes it back to this area again, then those buyers are likely to become active again and try to push the price upwards again. This means this area should work as a Support.
Now we wait
So what now? Now we wait. It is that simple.BTW this is why I really like to trade with Volume Profile this way – I do a market analysis, find strong Support/Resistance zones, and then wait until the price comes to those zones. Only then I trade.
This method is highly efficient and I don’t need to spend too much time watching the charts all day long, waiting for a trade-entry signal.
I hope you guys like this!
Have a GREAT weekend and I will see you on Monday with a new Weekly Trading Ideas video!
Happy trading!
-Dale
-Dale
- Get link
- X
- Other Apps
- Get link
- X
- Other Apps
Comments
Post a Comment