A New Counter-trend Resistance on USD/JPY
The
USD/JPY is from the longer-term perspective in an uptrend. There were
signs of strong and aggressive buyers pushing this pair upwards.
More about this in my Weekly Trading Ideas video:
A Risky Situation on the USD/JPY
For many days there were only aggressive buyers but no aggressive sellers. This changed in today’s Asian session when Bank of Japan Monetary Policy Statement came up.
It is not really important what the statement said. Important is what the chart did as a reaction
USD/JPY, 60 Minute chart:

Whenever
I see a strong and aggressive buying or selling activity (like those
areas marked on the chart), I am very interested in volumes around those
areas.
So today, there was a strong selling and I was interested in the rotation which took place before the selling started.
I used the Volume Profile indicator to look into this rotation area to see how volumes were distributed there.
USD/JPY, 30 Minute chart:
So today, there was a strong selling and I was interested in the rotation which took place before the selling started.
I used the Volume Profile indicator to look into this rotation area to see how volumes were distributed there.
USD/JPY, 30 Minute chart:
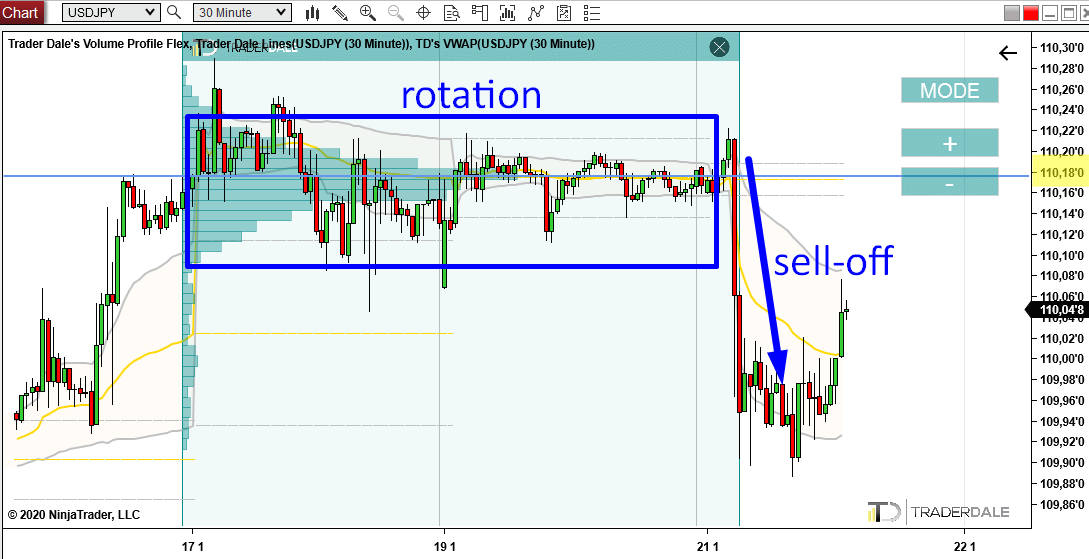
There was a huge amount of volumes accumulated in the rotation area.
From this Volume Accumulation area a strong sell-off started.
What this means is that strong sellers were building up their selling positions in the rotation, and then they pushed the price aggressively down into the sell-off.
----------------------------------------------------------------------------------------------------------------
Do you want ME to help YOU with your trading?
Join one of my Volume Profile Educational courses and get my
private trading levels, 15 hours of video content, my custom made Volume
Profile indicators, and more!
----------------------------------------------------------------------------------------------------------------
This is a standard setup I like to use in my everyday trading. The setup is called the Volume Accumulation Setup.
If you look at the picture, then the place with the heaviest volumes (where the profile is the thickest) – is a strong RESISTANCE.
I marked the level and highlighted the price (110.18).
So when the price hits this level, the sellers who accumulated their volumes around 110.18 should become active and start pushing the price down again.
Trading against the trend
There is one risky thing though. An important thing you ALWAYS need to pay attention to. The thing is, that if you go short from the resistance (110.18), you will trade against strong long-term uptrend. And this is always risky!
What I have to say to this is that there is no perfect and ideal trade. There is always some kind of risk. If there wasn’t, then everybody would be a pro-trader, right?
Anyways, it is up to us traders to tell whether the risk is worth the reward.
----------------------------------------------------------------------------------------------------------------
What I have to say to this is that there is no perfect and ideal trade. There is always some kind of risk. If there wasn’t, then everybody would be a pro-trader, right?
Anyways, it is up to us traders to tell whether the risk is worth the reward.
How I handle trading against the trend
If you ask how I trade such counter-trend trades, then what I do, is that I secure my position as soon as I can – by moving Stop Loss to the Reaction Point. When going counter-trend it is usually after the price made a 7 pip reaction. Also if the price turns little bit before the level and makes a reaction, then I am more prone to discard the trading level and let it be.----------------------------------------------------------------------------------------------------------------
Recommended Forex Broker
Having a solid broker with low spreads and commissions is ESSENTIAL for PROFITABLE TRADING!
Check out my recommended brokers
----------------------------------------------------------------------------------------------------------------
Happy trading!
-Dale
-Dale
- Get link
- X
- Other Apps
- Get link
- X
- Other Apps
Comments
Post a Comment