If you ask
me what Volume Profile setup I like the most, then my answer would be
Volume Accumulation Setup (explained more in detail here: Volume Profile Setups).
What I like even more than that is when two (or more) trading setups align and they both point to one support/resistance.
This is the case on today’s EUR/GBP.
After they entered their positions, they pushed the price downwards.
When the price makes it back to the area, where they were accumulating their positions then it is likely that those big sellers will start selling again.
What I like even more than that is when two (or more) trading setups align and they both point to one support/resistance.
This is the case on today’s EUR/GBP.
Volume Accumulation Setup on EUR/GBP
In the picture below, there is EUR/GBP, 30-minute chart. In this chart, there was a heavy volume area, from which strong and aggressive selling activity started. This makes me believe that there were big institutional sellers building-up their selling positions (in the rotation).After they entered their positions, they pushed the price downwards.
When the price makes it back to the area, where they were accumulating their positions then it is likely that those big sellers will start selling again.
Support becoming Resistance Setup
But there is also another setup here – Support becoming Resistance setup. More about this setup here (S→R setup explained)If you look to the left of the chart, then you can see that the price jumped off from the marked level pretty strongly. This is how you can tell it was a strong Support in the past.
Later, when the price went through it, then the Support became a Resistance.
When two setups align
Now, the cool thing is this: Volume Accumulation Setup and Support becoming Resistance setup both point us to the same resistance (which is in the 0.8488 – 0.8496 area)!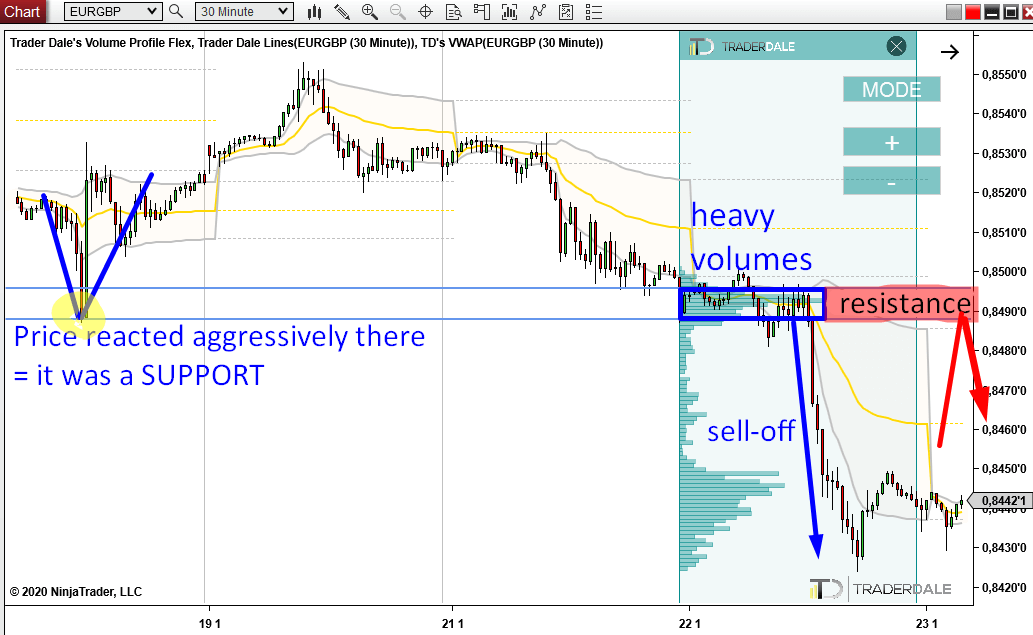
This is what I call a nice confluence of Volume-based setup and Price Action setup! This is what makes really nice and strong Support and Resistance trading levels.
It is the release of Main Refinancing Rate + ECB Monetary Policy Statement, and then the upcoming ECB Press Conference (which might be the biggest market mover)
Macro news
As always, there is something to be careful about. This time it is upcoming macro news which will heavily affect the EUR.It is the release of Main Refinancing Rate + ECB Monetary Policy Statement, and then the upcoming ECB Press Conference (which might be the biggest market mover)

So, if
this Resistance gets hit few minutes before, during or in the
post-macro high volatility, then it would be super risky to enter a
trade there. When there is strong macro news like this, then markets are totally unpredictable.
Consider this a strong warning!
Consider this a strong warning!
Happy trading!
-Dale
-Dale
- Get link
- X
- Other Apps
- Get link
- X
- Other Apps
Hey, thanks for the information. your posts are informative and useful.
ReplyDeleteKaya Ltd