(you can turn on subtitles, and you can also use automatic translation to all world languages!)
Which One Wins: Technical Or Fundamental Trading Strategies?
There have always been two groups of traders/investors – technical analysts and fundamental analysts. They usually don’t go together well because everybody thinks the opposite and they hardly ever agree. So, which of these approaches is better for us as traders? Some of you know that I studied Finance in college and that I also worked as a market analyst for a brokerage company. Afterward, I started trading full-time. At school and in the brokerage company, we were mostly taught and led to fundamental analysis – which was prioritized there. Currently, as a full-time trader, I focus mostly on technical analysis. So, I learned my share of both.For this reason, I think my opinion on this topic could be at least interesting for you. Of course, you are free to disagree. I will gladly have a discussion with you in the discussion panel below the article.
There will always be those guys, who …
First I must say that in both groups – technical and fundamental analysts there are some kinds of people who get on my nerves and with who I strongly disagree. Among the technical analysts, it is those guys who use all those indicators the internet is full of and who act like they found a Holy Grail among them. You know that I can’t stand those, right? :).In the other group – the fundamental analysts; I can’t really take seriously all those big company analysts who tell you ALL the reasons why something happened. Yes – happened – in the past. S&P 500 went down yesterday? “Here are 5 reasons why…”How does that help me today though? I don’t really care why it crashed yesterday. I need to know how to make money TODAY, or in the future.
Let’s now have a closer look at technical analysis and fundamental analysis. Let me tell you what I consider the pros and cons of working with those different approaches. I will also show you how to apply each of the two styles best to predict market movements.
Technical analysis
Ability to forecast
If you have a good trading strategy, then the technical analysis is definitely able to forecast future price development. It can successfully be done on all the timeframes. It is also able to tell us where the price will turn or whether there is a chance the current trend will continue or not. Take for example the volume profile strategy that I teach – it can predict with high a probability the places where the price will turn. You can apply this strategy to any timeframe and to any trading instrument. I can’t say the same about the fundamental analysis though!Sure there are cases where even the technical analysis fails. This occurs primarily when the markets are news driven. When there is a strong fundamental factor – like for example unexpected change of the central bank’s rate policy, then the technical analysis often fails, and the price just shoots past all the strong zones. That’s simply because the markets went crazy about the new, unexpected situation. If there isn’t a fundamental factor like this, the price reacts quite reliably on volumes and on price action support and resistance zones.
Fundamental analysis
Ability to forecast on short and mid-term timeframes
There is an economic theory called the Efficient Market Hypothesis (EMH). It says that every significant piece of news is almost immediately reflected in the price and therefore it is almost impossible to constantly profit from it. Being a trader for so long, I tend to agree with this theory. You know it yourself – there is strong news, the price jumps up or down (or both), and then the markets are calm again. That’s a common phenomenon. How do you want to profit from that? This is exactly why I think that in the short and mid-term timeframe, you can’t really make any constant profits using fundamental strategy.If it were possible to forecast macro news numbers and reactions to those numbers, then it would also be possible to predict price moves in short or mid-term. However, in my endeavor to do this, I came to a conclusion that it is close to impossible to guess the outcome of the news and to predict how the markets will react to the news. You may be right a few times, but in the long run, it just doesn’t work.
My conclusion is that in the short and mid-term timeframes, it is not possible to make constant profits using the fundamental analysis.
Efficient Market Hypothesis in real trading
A few months ago I released an EUR/USD analysis where I predicted that the price of EUR/USD would drop severely down. There were people who told me that this was crazy because all the fundamentals pointed to strengthening the pair. There is one important thing though! All the fundamentals were already priced in (this is the EMH theory)! It is the surprise that drives the price, not the things everybody knows. If there aren’t any new, unexpected fundamental factors, then it is best to follow solely the technical analysis – like I did with the EUR/USD.Another thing in which the fundamental analysis fails is to tell us where the price will turn. Technical analysis can do it – for example the volume-based technical analysis which I use. Fundamental analysis can only indicate that some asset is underpriced or overpriced, but it fails to tell us where the price will turn. It only tells us that the price SHOULD turn, but it doesn’t really tell us where.
Ability to forecast on long-timeframes
Fundamental analysis works quite nicely in the long-timeframes. Traders and investors use it most often to find assets (stocks, indexes, commodities,…) that are underpriced. This means that an investor is trying to buy an asset with bigger value, then the current market price of the asset is.So if you find a solid company with strong fundamentals and which isn’t overpriced, then you will make money as the company will grow and more and more people will understand its true value. This can be done not only with stocks, indices or different futures contracts. Such fundamental analysis also works with currencies.
Fundamental analysis of currencies
Since most of you guys here are currency traders, I think that you may be interested in how to approach evaluating currencies from the fundamental point of view.With currencies, you need to consider the whole macroeconomic situation of the country/region emitting the currency. The reason is that the currency is only as strong as the economy behind it. The most important factors in evaluating this are for example the health of the economy, debt (you can see the real debt of world economies here: World Debt Clocks), resources, how strong the government and laws are if it has its own currency and independent monetary policy, …
Example
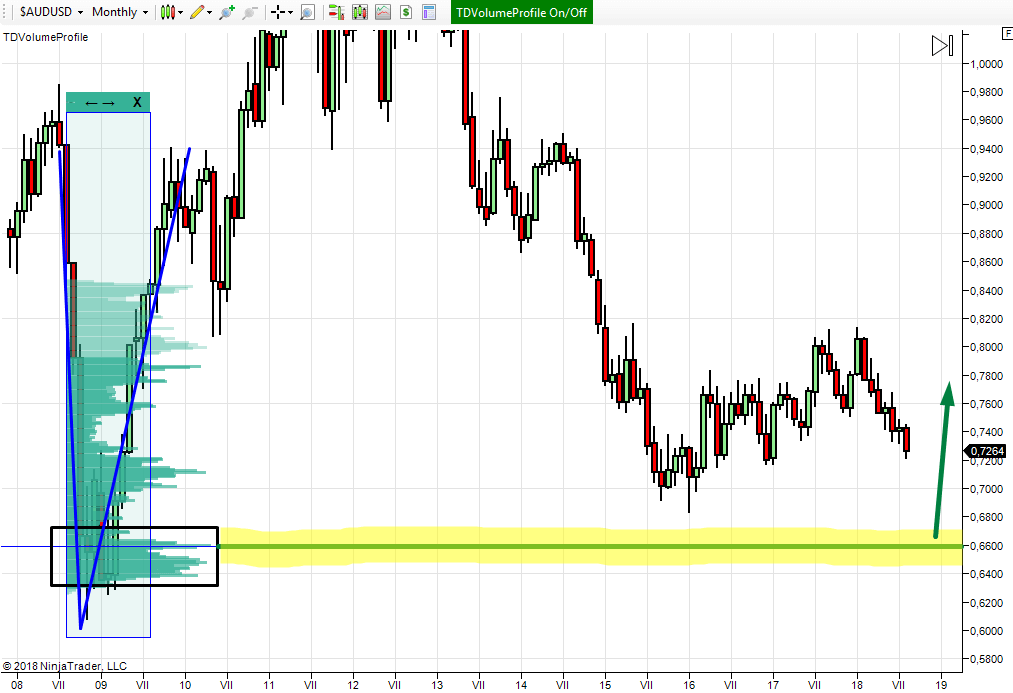
I think that good and healthy currencies to invest in are for example the AUD or the CAD. Both Australia and Canada have a healthy economy, their debt isn’t astronomic (unlike for example the US debt), they have natural resources, independent and solid governments, solid law system, and they have their own independent monetary policy which they freely apply.So, let’s say that you want to invest in the AUD, so you use the Volume Profile tool to look for a good place to enter your long position. You can use the same volume setups I teach in my course or in my book. In this case, there is nice “Rejection setup” on the monthly AUD/USD chart. Strong rejection like this indicates that there were strong and aggressive buyers rejecting the lower prices. It is likely that they placed most of their positions around 0.6600 – that’s where the profile is the thickest. When the price makes it back to this price level again, then I think that those aggressive buyers will defend their long positions and that they will push the price upwards again. Yes – I know that this level is 10 years old and yes, I think the market still remembers it.
So to sum it up – if we would like to invest in the AUD currency, then a good place to do it would be around 0.6600
My conclusion
The conclusion from all this is: if you want to trade on lower timeframes then don’t bother with the fundamentals. There is no way you can predict their outcome and use them to your advantage. You will do best to focus solely on the technical analysis.If you feel more like an investor and not a day-trader or a swing-trader, then I think it is best to combine technical analysis with fundamental analysis. This way you can, for example, find solid stocks, indexes or currencies (using fundamental analysis) and then you can find places in the chart where you will purchase these assets (with technical analysis). The best way to search for such places is in my opinion with the Volume Profile which I consider the most superior tool the technical analysis has.
Happy trading,
-Dale
P.S. Check out my new book: VOLUME PROFILE: The insider’s guide to trading
P.S. I am using my custom made Flexible Volume Profile for all my analysis. You can get it here: TD’s Flexible Volume Profile
P.P.S. Want my intraday trading analysis every day as well as swing trade analysis for 15 forex pairs every month? Then check out my Advanced Volume Profile Training Course and Members Forum for more information – Click Here to Start Learning Now
Comments
Post a Comment