Trade Ideas, Setups, Chart Analysis – 6th August 2018
**You can learn more about my trading setups in my new book: VOLUME PROFILE: The insider’s guide to trading
SWING TRADES
All presented swing trade charts are Daily charts (Daily candles) if not stated otherwise.NZD/CAD short from 0.8880 area
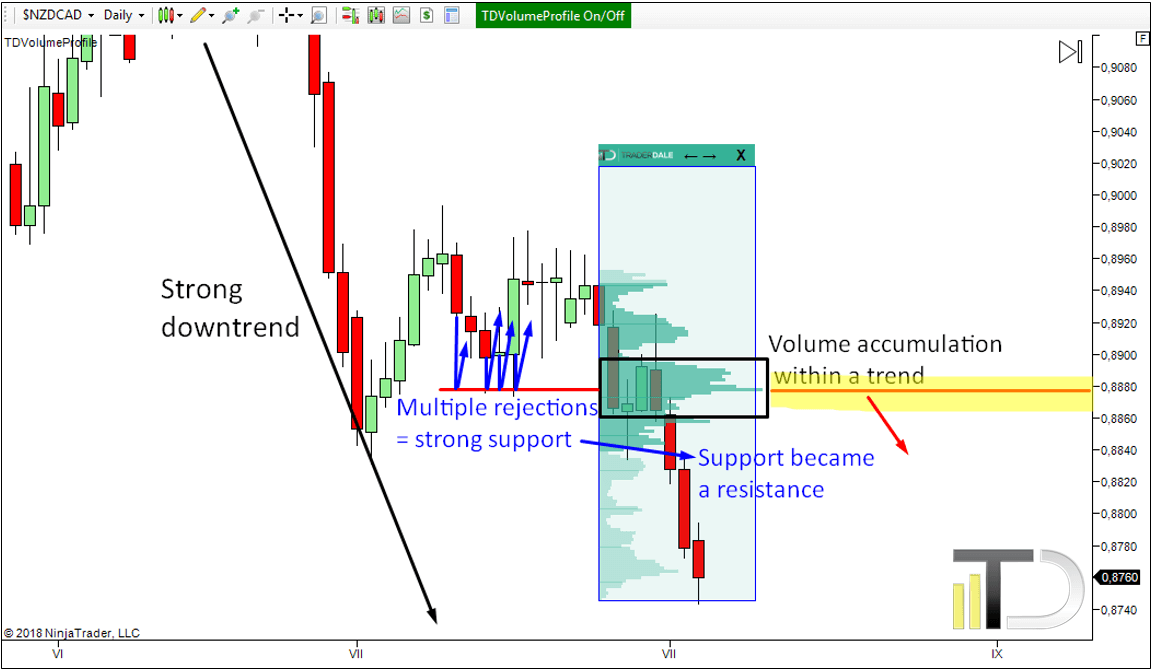
There are three things I like about this short level. The first one is that there is pretty strong downtrend on the NZD/CAD right now. Trading in the direction of a trend is always better.Secondly, there was my “Trend setup” created within the trend. The Trend setup clearly shows where the sellers were adding to their positions. It was around 0.8880. From this area, they pushed the price lower. When the price makes it back there, the sellers will most likely defend their positions and they will push the price lower from this area again.
The third thing I like about this level is that it worked as a strong support zone. The price reacted to it four times before it went through. When it did so, the support became a resistance.
AUD/CAD short from 0.9740 area
Pretty long sideways price action took place on the AUD/CAD in the previous month. There were some huge volumes accumulated there – most of them around 0.9740 area. I think that those volumes were volumes of strong sellers who started an aggressive selling activity after the volume accumulation. When the price makes it back to this level, those sellers are likely to defend their positions and push the price lower again.AUD/CAD short from 0.9650 area
Another short I would like to take on the AUD/CAD is based on the “Trend setup” and also on the “Support becoming resistance” setup. There are pretty significant volumes accumulated in a volume cluster within the downtrend around 0.9650. This is a good place for a short trade also because the price strongly rejected this area in the previous month. This rejection indicates that it was a strong support zone. When the price went through it, it became a resistance.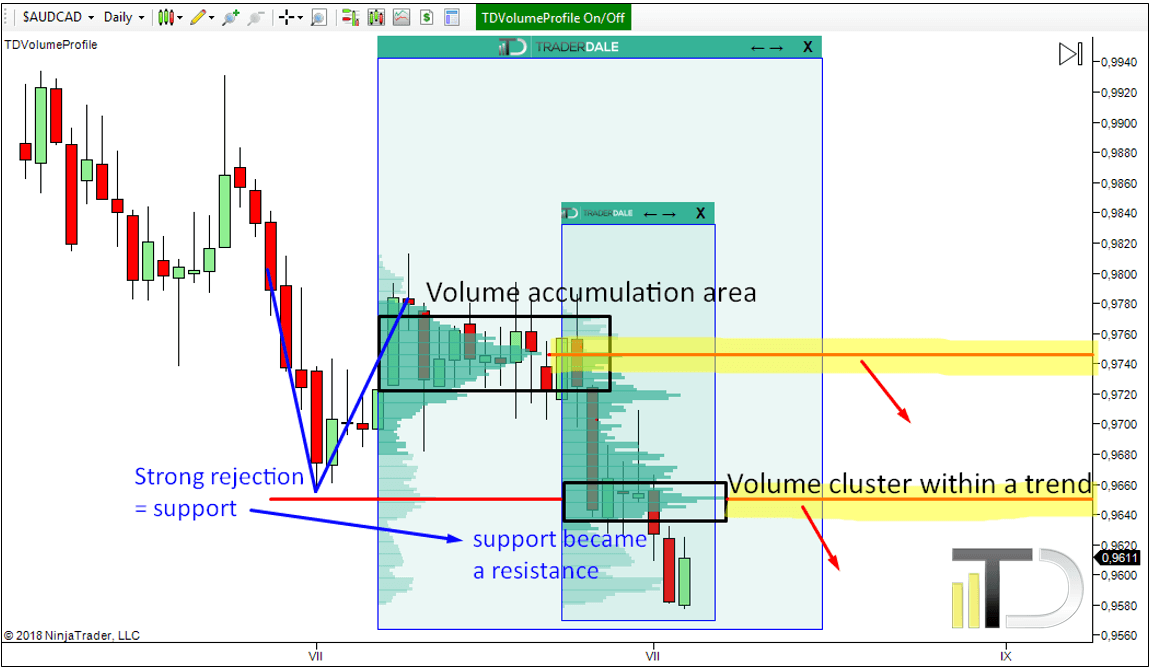
USD/JPY long from 111.05 area
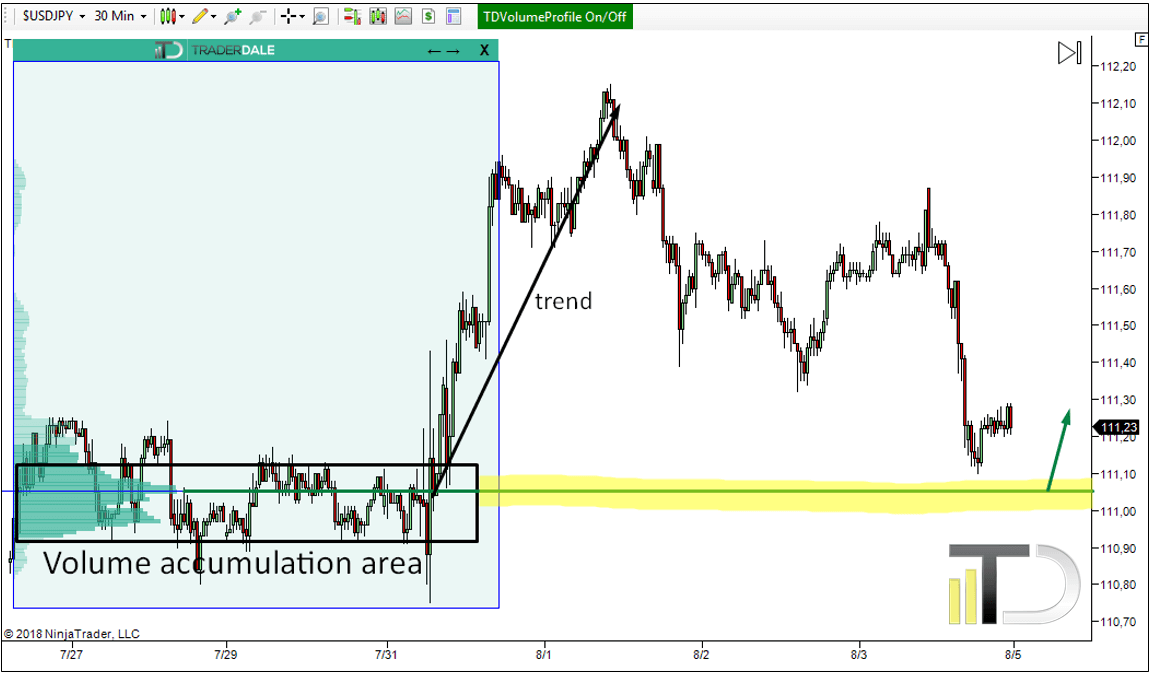
Even though this is basically a swing trade, I decided to show it to you on a 30-minute chart because it is better visible there. In fact, this trade is somewhere between intraday and swing trade level.It is based on a very long accumulation area which was followed by a strong buying activity – an uptrend. This indicates that strong buyers were accumulating their positions in the rotation and finally pushing the price aggressively upwards. When the price makes it back to this level, those buyers should defend their positions and they should push the price upwards again. Good SL for this trade should be somewhere in the 110.70 – 110.80 area below the significant swing low. That is around 30 pips distant from the entry point.
INTRADAY TRADES
USD/JPY short from 111.70 area
There was a pretty strong sell-off on the USD/JPY on Friday. This was preceded by volume accumulation and aggressive rejection of higher prices. This tells us that there were significant sellers entering their selling positions. Those sellers also aggressively rejected higher prices (during a false breakout) and then they initiated aggressive selling activity. When the price makes it back to this area, those sellers are likely to defend their selling positions and push the price lower again.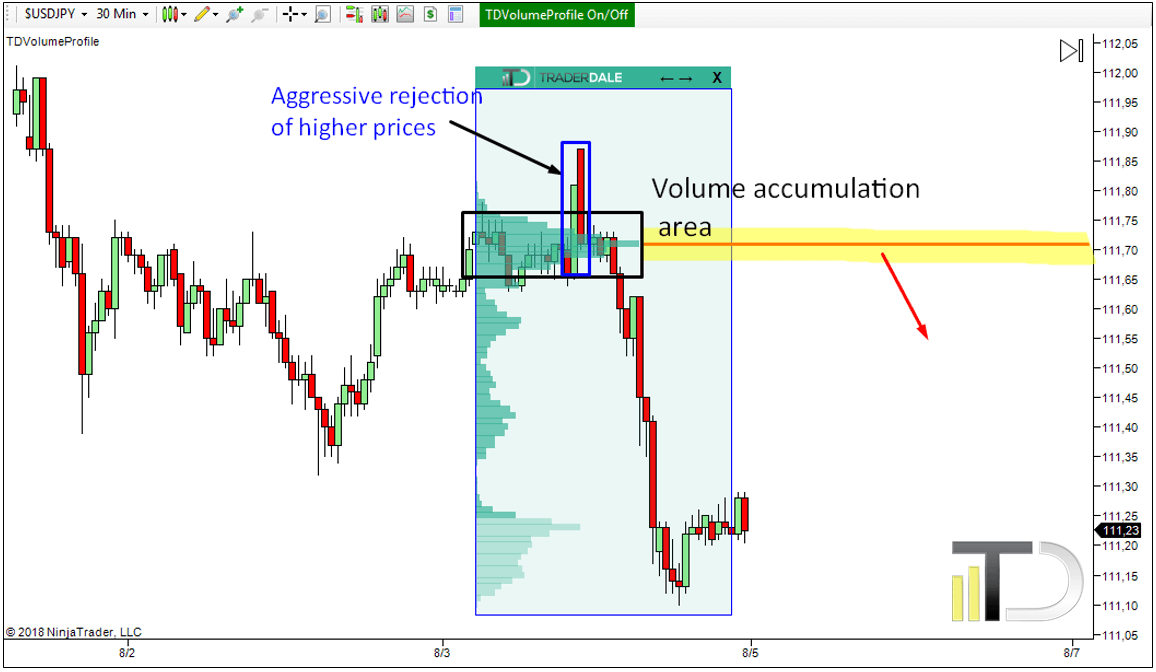
USD/CHF long from 0.9880 area
Heavy volumes got accumulated in a sideways rotation before a beginning of a strong uptrend. This tells us that strong sellers were entering their buying positions in this rotation area. After they entered their positions, they initiated a strong buying activity. When the price makes it back to this area again, the strong buyers will most likely defend their buying positions and they will push the price upwards again.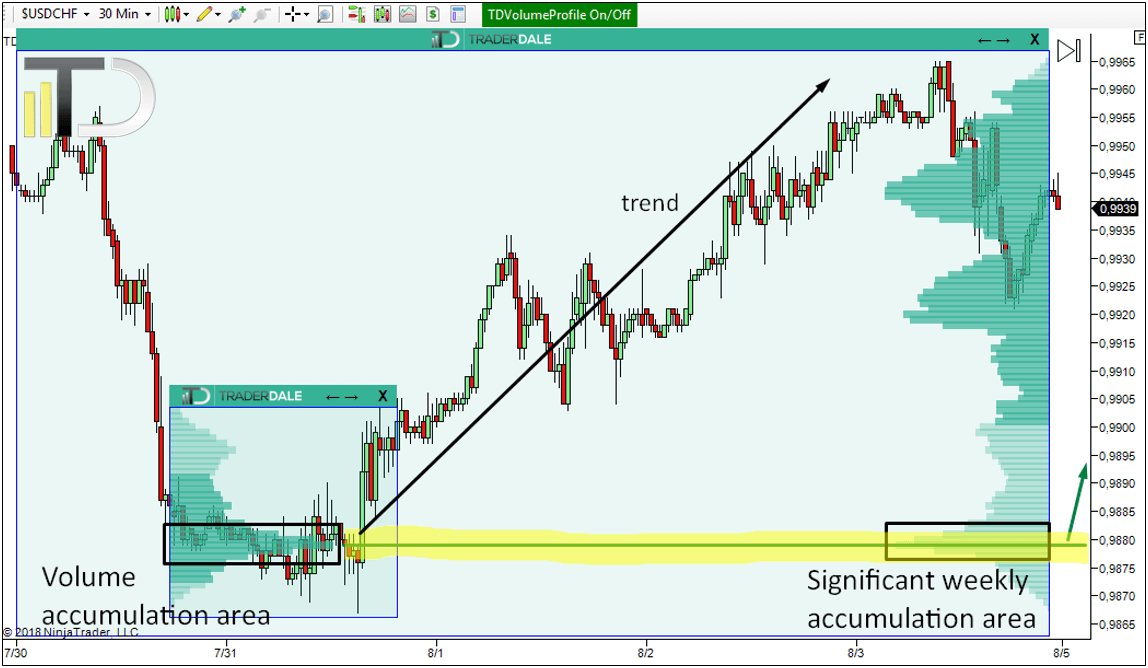
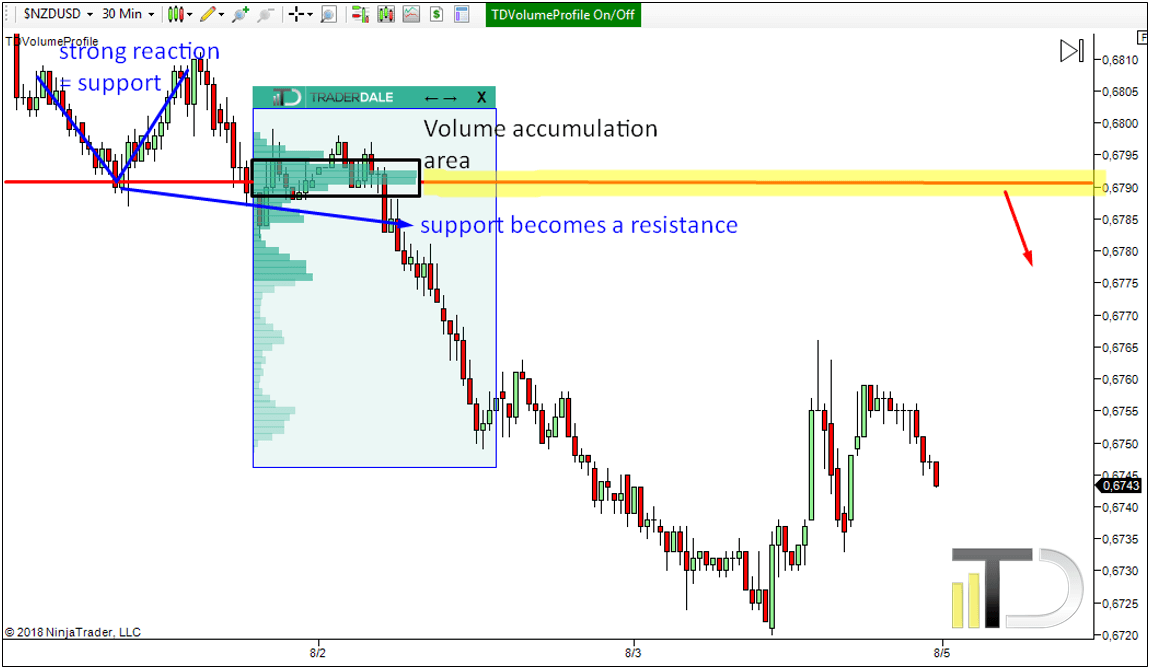
NZD/USD short from 0.6790 area
There are two reasons for this short level. The first reason is a Volume accumulation setup which formed before the start of an aggressive selling activity.The second reason is a setup called “support becoming a resistance”. There was a strong reaction to this area before – as indicated in blue in the picture. This tells us that the level was a strong support. Afterward, the price went through this support and the support became a resistance. So, not only there is a volume setup but there is also another additional setup to confirm our short level.
I hope you guys found my ideas inspiring and useful.
Happy trading
-Dale
PS. I have just released a new book: VOLUME PROFILE: The insider’s guide to trading. I put a ton of work into it and I am sure it will prove extremely helpful to you. Go and get your copy HERE. I guarantee you that this will be the best $4.99 you ever spent.
PPS. I am using my custom made Flexible Volume Profile for all my analysis. You can get it here: TD’s Flexible Volume Profile
PPPS. Want my intraday trading analysis every day as well as swing trade analysis for 15 forex pairs every month? Then check out my Advanced Volume Profile Training Course and Members Forum for more information – Click Here to Start Learning Now
Comments
Post a Comment