One of my most favorite Price Action strategies goes like this:
Support becoming resistance (and vice versa)
This Price Action strategy works very nicely even as a standalone strategy. I usually spot it in the charts every day, so there are quite a lot of trading opportunities with this one.The setup works both ways – support becoming a resistance and also resistance becoming a support.
Here is how to spot it and how to trade it:
- To identify this setup, you first need to see the price strongly reacting or jumping away from some area in the chart. This strong reaction indicates that there was strong support or resistance in the area.
- One big reaction is enough but two or more strong reactions are even better. This way you can be sure there was a really strong support or resistance area.
- After spotting such a strong area, you need to wait for the price to go past it. You want to see this strong support or resistance breached.
- Even though the support/resistance was breached, it is still significant and strong. The reason is that breaching such a level requires a lot of effort and volumes of strong buyers or sellers. This area will be “defended” again. This is how support becomes resistance and how resistance becomes support.
- When you identify support becoming resistance (or resistance becoming support) level, you wait for the price to come back to this area and enter your trade from there.
- This setup works for all timeframes. I personally like to look for it on daily and on 30-minute charts.
Let’s have a look at some examples:
The first one is an EUR/USD 30-minute timeframe. The price made two strong rejections of a level which indicates that it was a strong support zone. Then the price went through it which made it a new resistance zone. Entry for a short trade would be after a pullback to this price level – the newly formed resistance level.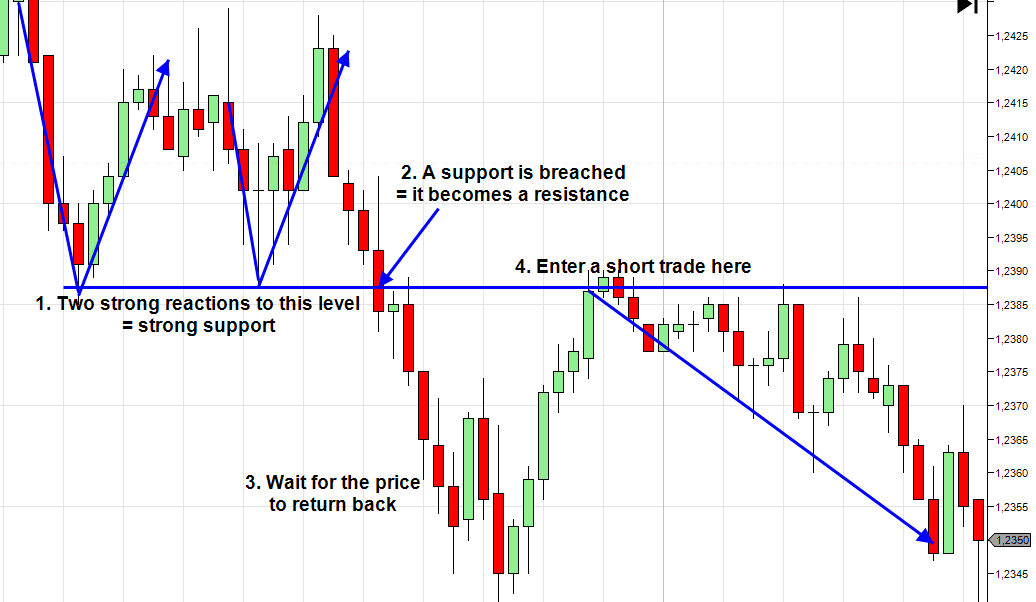
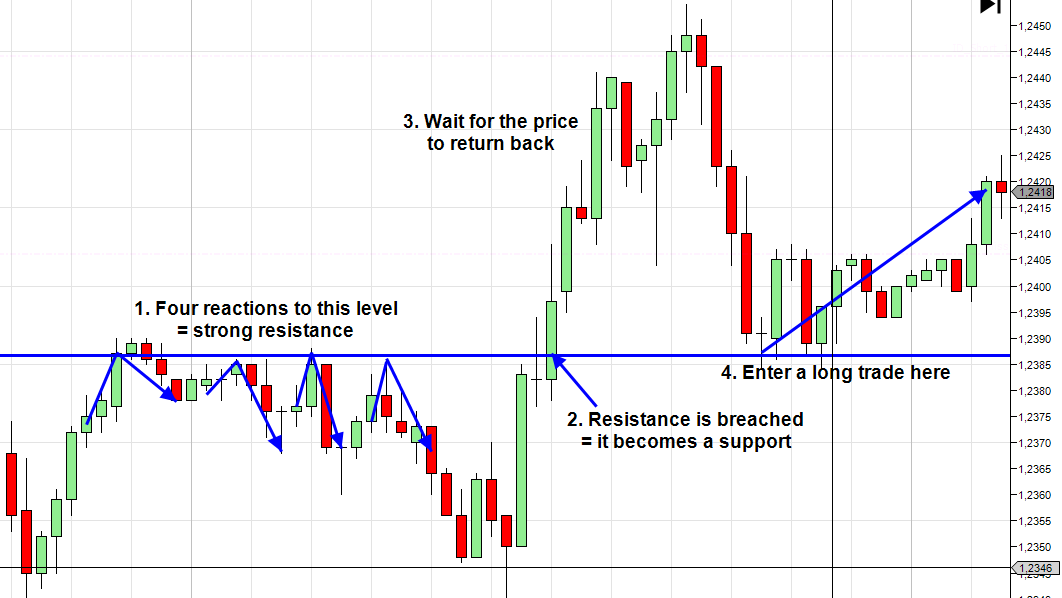
Below, you can see the second example. It is the same chart, only a few hours afterward. You can see that the reaction to the strong resistance level you saw in the previous picture actually became support again. In the picture, you can see four reactions to the level – confirming that it was a strong resistance level before. When the price went past it, then it became a strong support zone (again). The idea of trading this one is the same as in the previous picture, only reversed. In this case, you see a strong resistance that was breached. You wait for the price to come back to this area and go long from there – from the newly formed (in this case reestablished) support level.
Confluence with volume-based strategies
Let me now show you how to use this Price Action strategy as a confirmation of a Volume-based strategy.Volume-based confirmation:
Below, there is a screenshot taken from my older long-term analysis of the EUR/USD which I published in January 2018. The main idea behind my short trade was a Trend setup (a volume-based setup) on the Monthly chart. My short level was around 1.2500 – at the place where the volumes in the volume cluster were the heaviest (volume cluster is marked in a black rectangle).Price Action confirmation
Let’s now have a look at this from the Price Action point of view. There were three really strong reactions to the 1.2500 area before. I marked them in blue. As you can see the price bounced off this area three times in the past. This means that the level was a really strong support. When the price finally went past it, this support became a resistance – that’s the Price Action confirmation of the 1.2500 short level.How to chose the EXACT level
So, there is a Volume-based level and also a Price Action setup which confirms that level. I must say that the “confirmation strategy” will only rarely show you EXACTLY the same level as the Volume-based strategy. The important thing is that it should be roughly in the same area. As far as the EXACT level selection is concerned, I prioritize the Volume-based strategy to the Price Action strategy so I usually place my level exactly at the highest volume peak.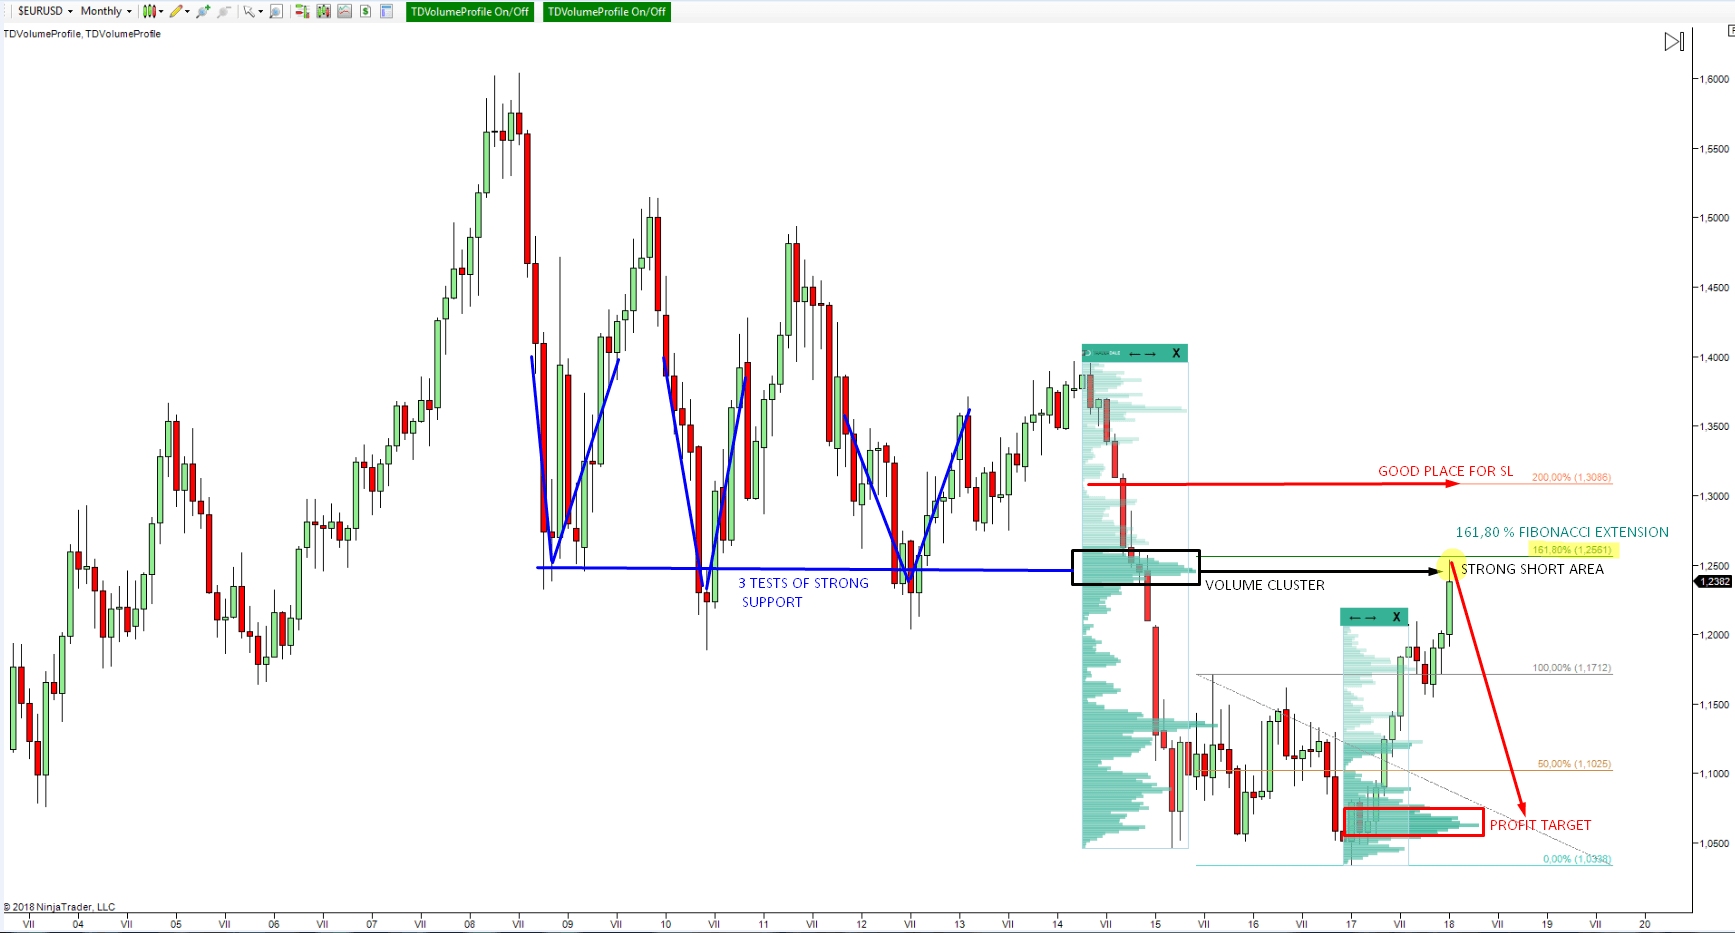
If you are wondering how this trade is going, then I am still in the trade. Currently with + 1.147 pips in open profit.

So, guys, that’s all about the Support becoming resistance setup. It is really good and working Price Action strategy. As I said in the beginning – one of my favorites. You can use it as a standalone strategy as well as a confirmation strategy for your volume-based strategies.
There are more Price Action strategies like this one in a book I have just released. You can get it here: VOLUME PROFILE: The insider’s guide to trading
Happy trading
-Dale
P.S. I am using my custom made Flexible Volume Profile for all my analysis. You can get it here: TD’s Flexible Volume Profile
P.P.S. Want my intraday trading analysis every day as well as swing trade analysis for 15 forex pairs every month? Then check out my Advanced Volume Profile Training Course and Members Forum for more information – Click Here to Start Learning Now
Comments
Post a Comment