
USD/JPY: Volume Profile and Price Action Analysis


Trader Dale - Free Book

Hello guys,

in today’s daily analysis I will talk about a newly formed Support on USD/JPY.

Yesterday, there was a long rotation on USD/JPY. Nothing special, really. But what made this rotation interesting was the strong buying/trend activity that followed in today’s Asian session.

Why? When there is a rotation followed by an uptrend, then it indicates that strong Buyers were building up their Long positions in that rotation. They were doing so slowly and unnoticed. Then they pushed the price aggressively upwards.

Volume Profile Analysis

When I see a rotation followed by a trend, I use my Flexible Volume Profile and I check out the volume distribution in that rotation and trend area.

What I want to see is heavy volumes in the rotation. Exactly like in the picture below!

USD/JPY; 30 Minute chart:

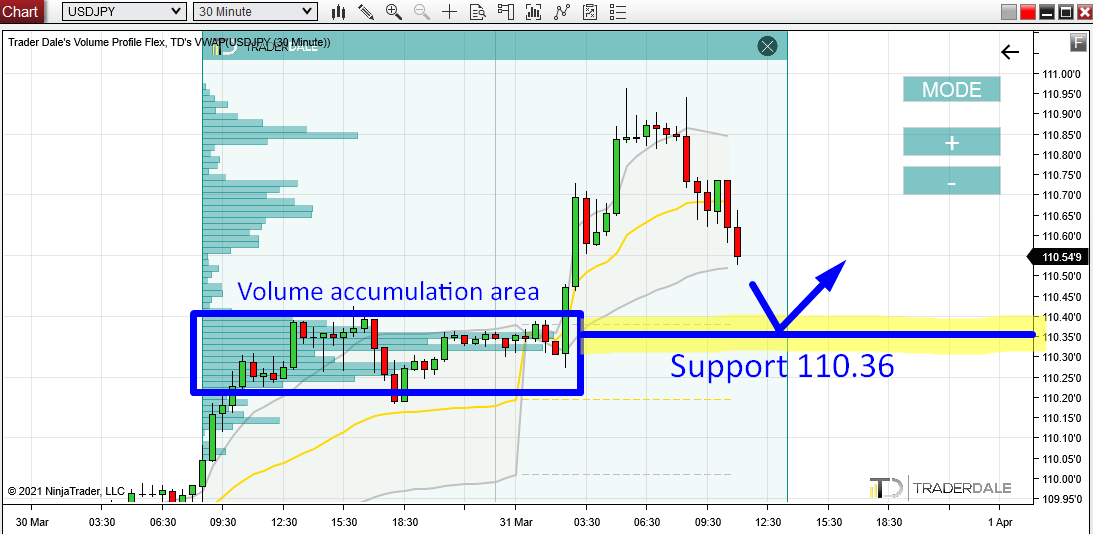
Those heavy volumes show the big institutional market participants getting into their Longs.

When the price makes it back into this zone (in this case around 110.36) then those institutional traders should defend this zone. Why? Because they placed a lot of their Long positions there. This zone is important for them!

They will want to defend this zone by pushing the price upwards from there again. That’s what makes this zone a strong Support.

This trading setup is one of my favorite Volume Profile setups. I call it the “Volume Accumulation Setup“.

Do you want ME to help YOU with your trading?

Join one of my Volume Profile Educational courses and get my private trading levels, 15 hours of video content, my custom made Volume Profile indicators, and more!

Weekly Point Of Control

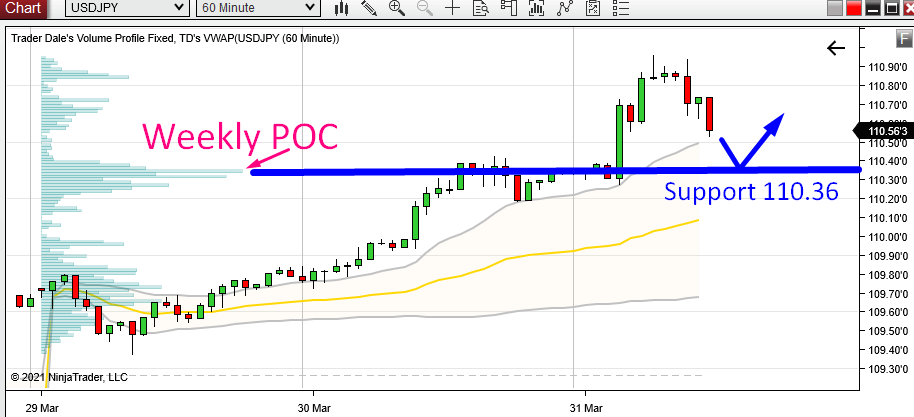
A nice addition to this is that our zone around 110.36 is also the Weekly Point Of Control (POC). This means that the heavies volumes from this week were traded there.

A strong trend activity commencing from a Weekly POC is always a very important thing to notice as the Weekly POC represents the most important price level from the whole week.

The chart below shows USD/JPY; 60 Minute chart with Weekly Volume Profile:

I hope you guys liked today’s analysis! Let me know what you think in the comments below.

Happy trading!

-Dale

Comments

Popular posts from this blog

Beginners Guide to Order Flow PART 1: What Is Order Flow?

DEFINITION: Order Flow is an advanced charting software which enables you to read all trading orders that are processed in the market. It helps to track the BIG financial institutions through the trades they make. Most people get confused when they open up a chart with Order Flow for the first time. There is no shame in that. Order Flow shows so many information and it is easy to get overwhelmed and confused if you don’t know what to look for! This Beginners Guide will teach you how to understand how Order Flow works and how you can use it in your trading! In this 1st part of the Order Flow Guide I will show you around the Order Flow interface. Footprints The Order Flow does not show standard candles, but it shows FOOTPRINTS . A footprint shows not only Open, High, Low, Close (as standard candles) but it also shows orders traded in that candle. Orders can be...

How To Trade The Point Of Control (POC)

DEFINITION: Point Of Control (= POC) is a price level at which the heaviest volumes were traded. The most important thing that the Volume Profile indicator shows is the POC. I dare say that if you used Volume Profile only for the purpose of identifying the POC, you would be a way better and trader then 99% of the retail traders. No matter what trading strategy you trade. Why do I say this? Why is POC so important? Point Of Control is so important because it shows the place where the most trading took place – where the biggest trading positions were accumulated. POC shows the BIG guys! Who accumulates those huge trading positions? The BIG guys – that’s the big financial institutions like hedge funds, pension funds, huge banks, etc… It is those BIG guys who move and manipulate the markets. It would be a huge advantage to know where they placed most of their positions, right? The good news is th...

NZD/CHF – How To Trade The “b-Shaped” Profile

Today’s intraday analysis will be on  NZD/CHF  and I will start by talking about the structure of the  Weekly Volume Profile . Weekly Volume Profile structure In the previous week, there was a  “b – shaped” Volume Profile histogram formed. b – shaped histogram means that the shape of the histogram  looks like the letter “b”. It says that the market sees the value at the bottom half of the profile while rejecting the upper half. If you look at the picture below, you can see that there was a  rotation  (Monday, Tuesday), then strong  buying activity  (Wednesday), and then an immediate  rejection and a sell-off  (Thursday). Then again a  rotation  on Friday. One of the most important things to notice in a b – shaped profile is a  volume cluster created in the rejection area. In this case, there were two of them. Such a  volume cluster  indicates a place where the  sellers were...