Traders often start lowering their criteria when they are having good trading results for some time. In most cases, this behavior is completely unintentional.
In this article, I will be showing you various examples of this ”criteria lowering” to help you avoid this common problem.
I will demonstrate this on a live account of one of my members. His name is Joe and he is an independent trader who trades with my swing trading strategy.
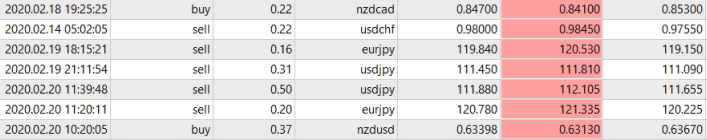
Joes’ live account history (27.1.2020 – 20.2.2020)
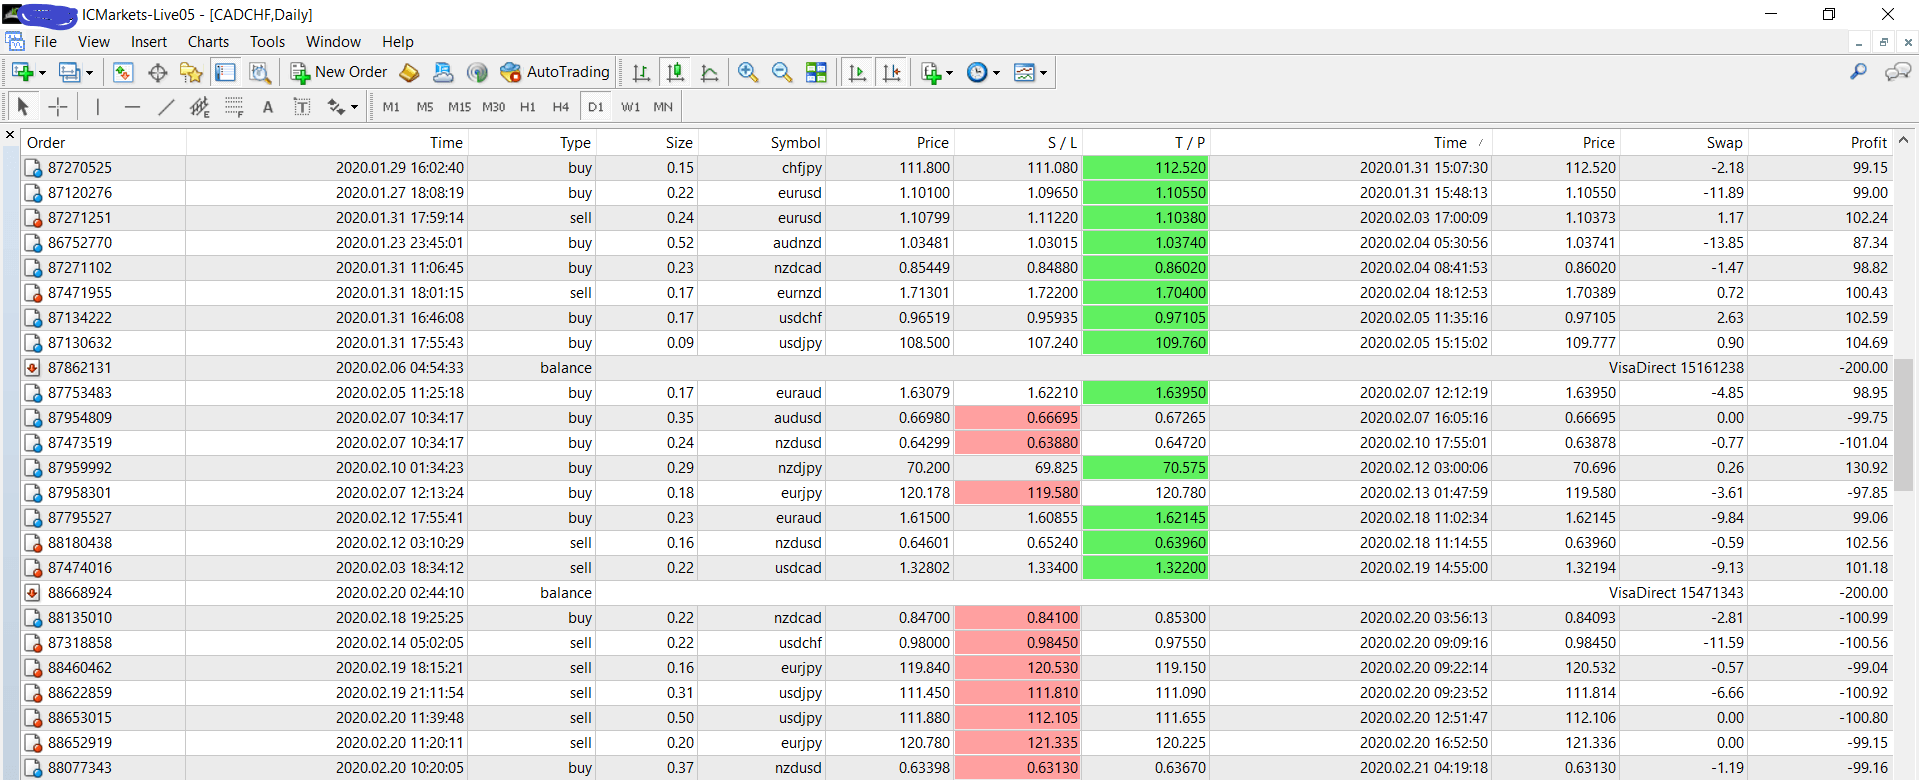
Joe is trading with Daily charts using my swing trading strategy. His risk to reward ratio is 1:1; $100 in Stop Loss and $100 in Take Profit.
He is also using my alternative stop loss method but there is no example of it in this part of his trading history.
In this picture, we can see he was having a winning streak which turned into a losing one right after that.
This is the result of unintentionally lowering his trading criteria after he has been trading really good for some time.
Let’s have a detailed look at his trades and lets also have a look at the trading mistakes he did.
I won’t focus just on the bad trades though. It is also important to have a look at the good ones. Because those are the trades we want to replicate, right? 
The Winning Streak (27.1. – 31.1.2020)
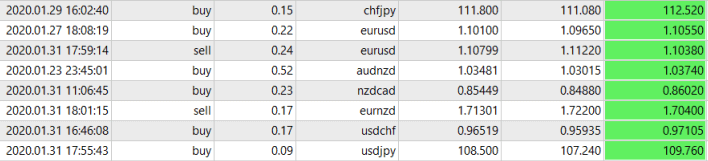
It would be a bit too much if I commented on every single trade he did, so let’s look just at a few examples.
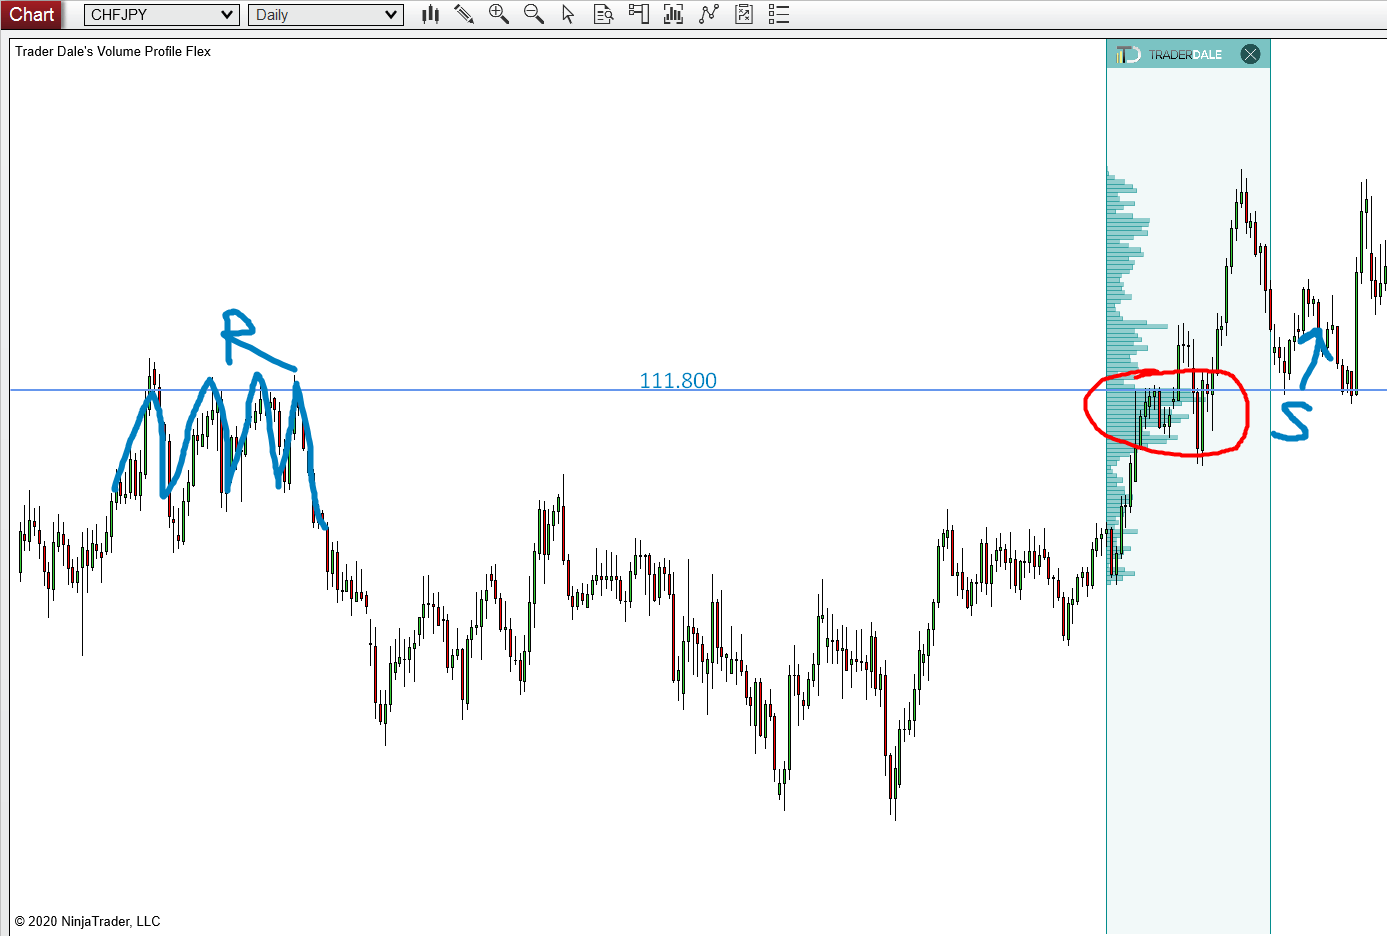
1.) CHF/JPY buy (29.1.2020)
In this nice long trade from the 29th of January 2020 Joe used my favorite trading setup. Which in essence is when price action and a volume cluster beautifully support each other at the same level.
There is not a thing I dislike about this Trend Setup trade he took. It perfectly suits my criteria for what I call ”One Good Trade”.
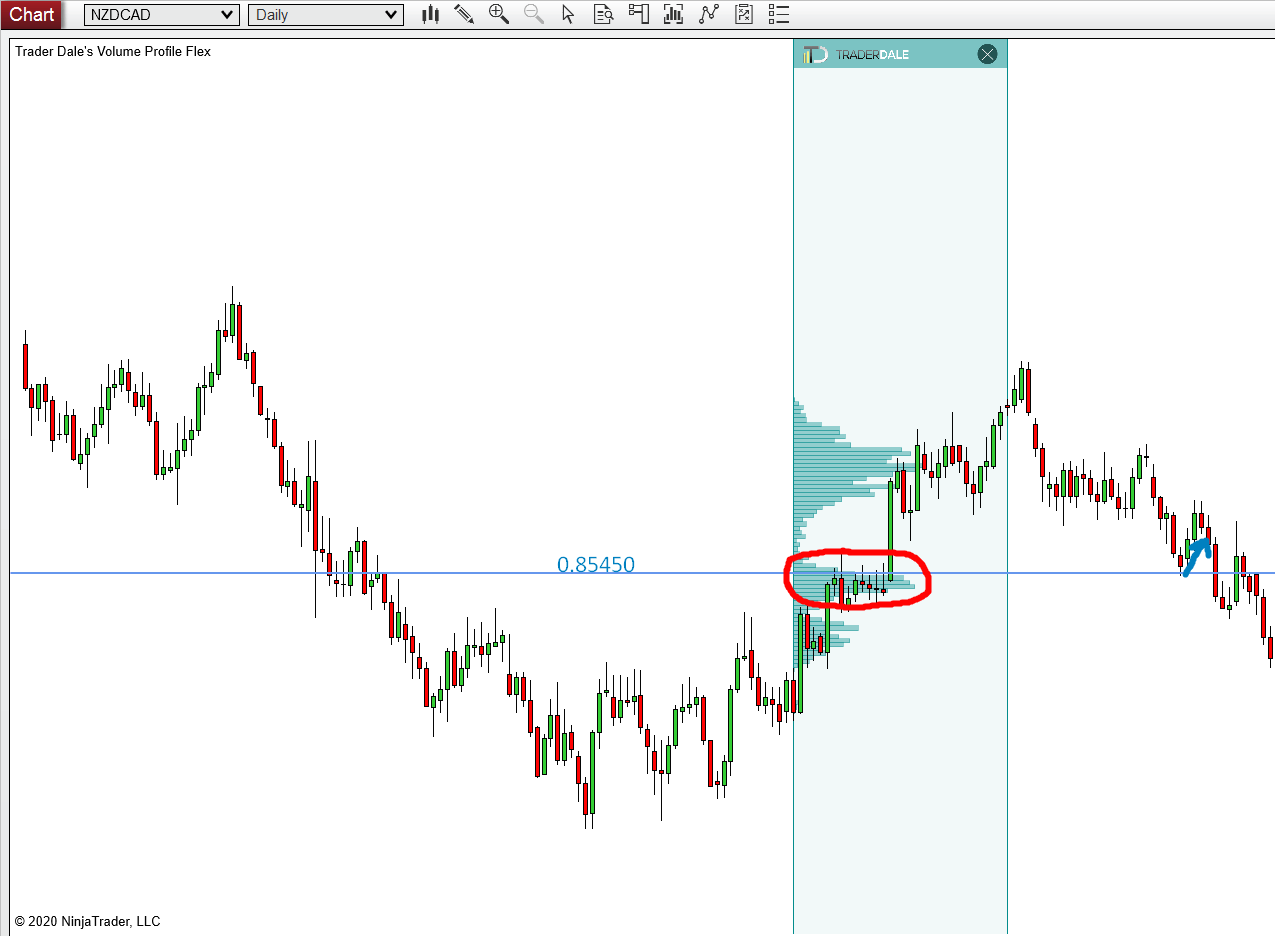
2.) NZD/CAD buy (31.1.2020)
One more beautiful example of a Trend Setup was on the 31st of January 2020. As you can see, the volumes were perfectly visible on this clear accumulation. Then this was followed by one huge bullish candle and some more buying activity after that. Overall a nice and strong signal to go long from.
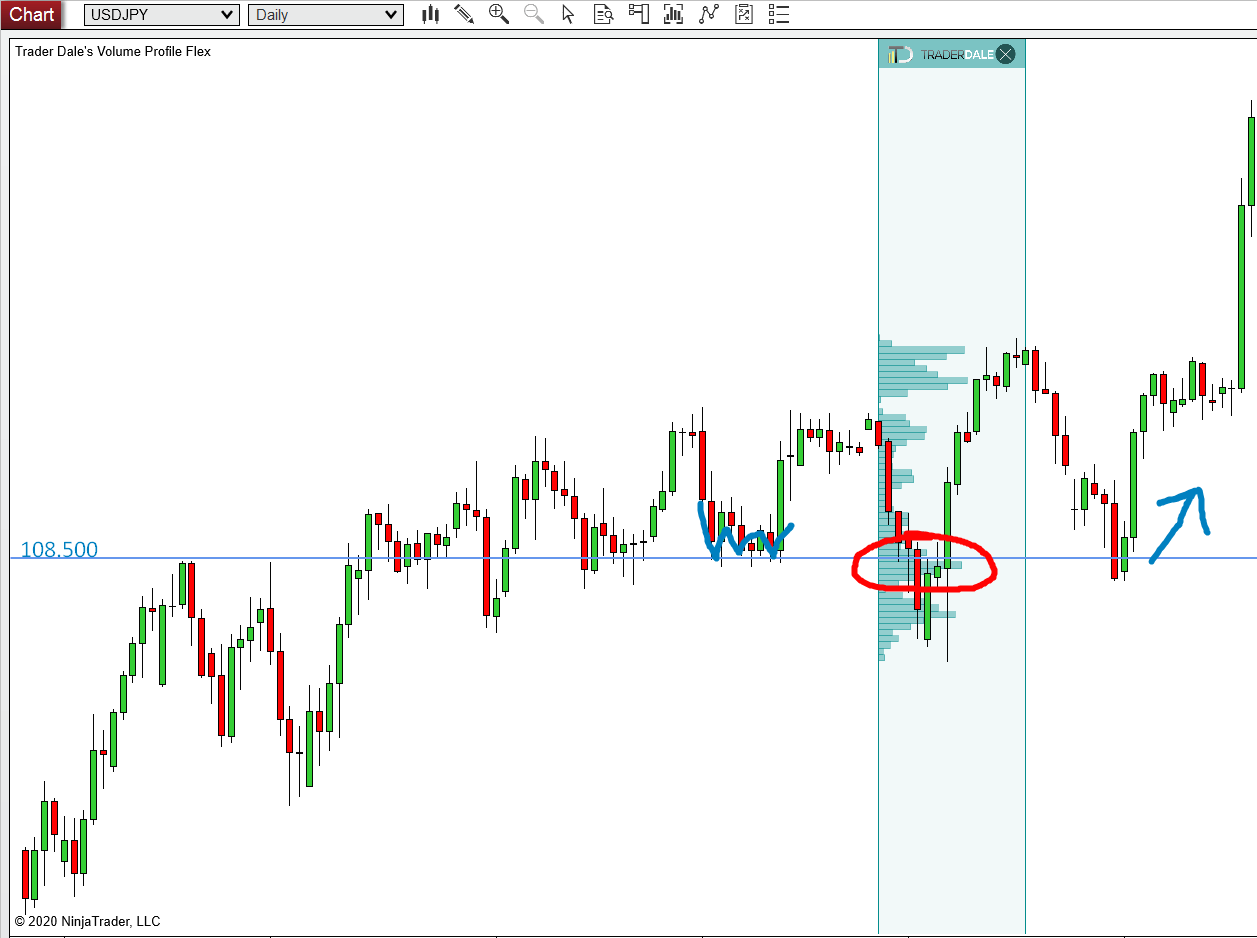
3.) USD/JPY buy – 31.1.2020
This was a nice example of a Rejection Setup and a bit of a different way of using my price action setup. It happened on the same day as the previous NZD/CAD trade.
In this case, the price went through an older support. Then it made a Rejection Setup and a significant volume cluster appeared exactly at the place where the previous support was. I circled this volume cluster in red. Later the price reacted nicely to this level and it was another nice winner.
I won’t be commenting on the rest of the winners here, but I suggest you check the rest of the levels from this winning streak yourself.
Joe was also trading pretty good in the middle section where he took a few losses. Those losses were good trades, based on a good analysis and they were well executed.
Those were the kind of losses that traders should not mind taking as they are part of every good traders life.
Let’s now jump straight into the losing streak which followed.

The Losing Streak (14.2. – 20.2.2020)
At this place, Joe unintentionally started placing trades with lower criteria because he was thinking too much about the money and how to get it as fast as possible. He also started to feel like “cool I got this, this is easy…“
Because of that, he wasn’t paying enough attention to what separates a good trade from a bad trade.
What many traders also do after a winning streak is that they start to trade with bigger trading positions (which is a mistake I write more about in my Volume Profile book). I am glad Joe did not do this mistake as this would have catastrophic consequences!
Let’s now have a look at some examples once again.
1.) NZD/CAD buy (18.2.2020)
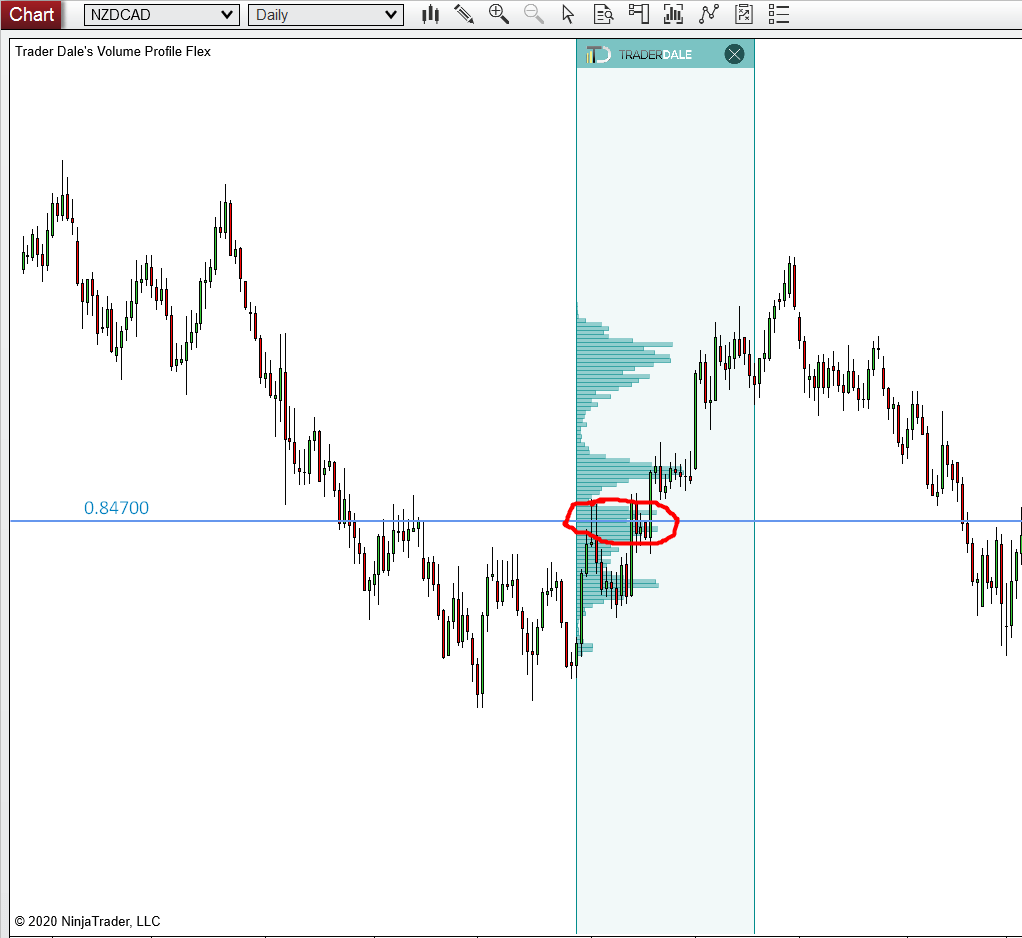
This is the perfect example of taking a bad trade right after a good one. As you can see, it’s the same scenario as in the winning streak example: NZD/CAD’s Trend Setup buy.
However, this time Joe lowered his criteria about how the volume cluster should look.
If we compare this trade with the upper winning one, we can see that this time the volume distribution is not so nice and clear. Instead, the volume cluster shows two places with heavy volume peaks.
In a case like this, it’s best to discard the level. It’s because the level is not clear. We need to see one clear volume peak which points us nicely to the place where the heaviest volumes got traded. When it is not clear, it is best not to trade it.
And of course, placing the trade right in between them isn’t a good idea.
2.) USD/CHF sell (14.2.2020)
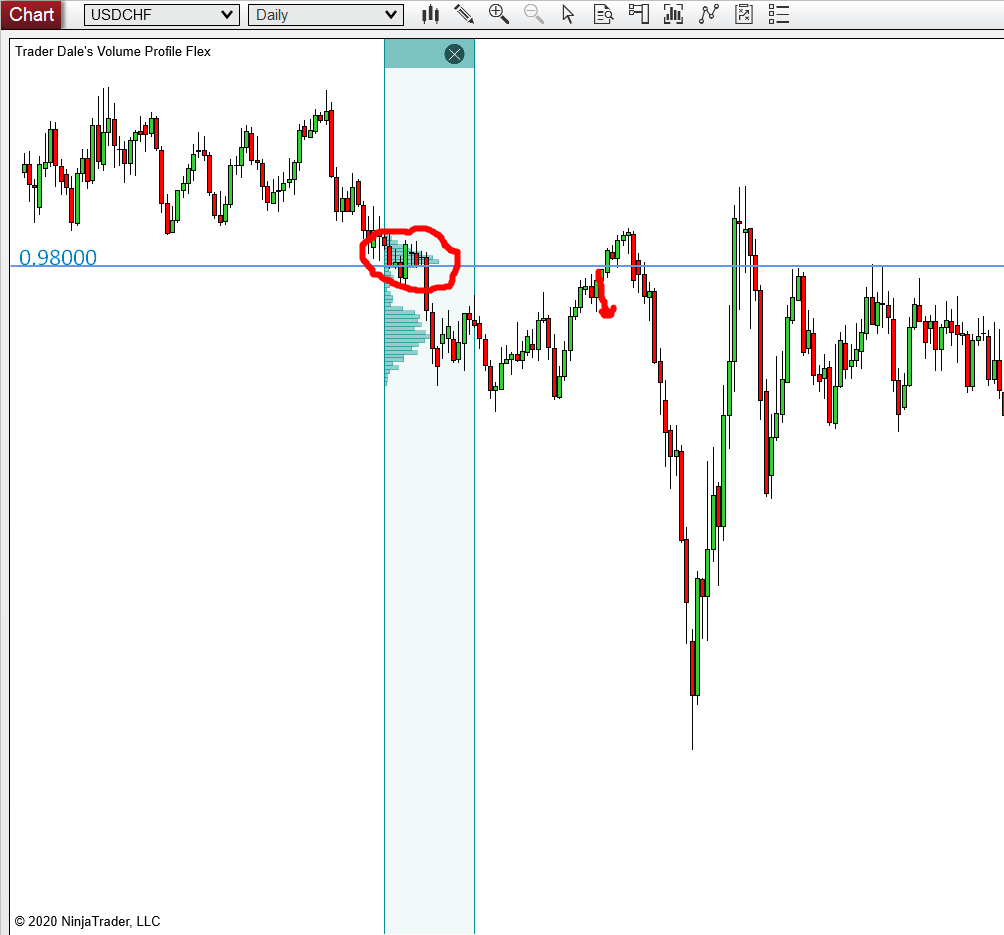
With this short trade from the 14th of February 2020, Joe made a mistake by ignoring the early test.
In cases of earlier reaction to our levels, it’s best to consider the volume cluster already tested and don’t trade from it anymore.
Sometimes it’s kinda hard to decide what is and what isn’t a proper early test (whether the level got already tested early or if it is still good to trade). What can help is for example making a rule to discard the level if there is 1.5 (150%) or more ADR (Average Daily Range) reaction to the level.
If you don’t understand the previous statement on ADR, please have a look at this article where I explained it more: How to Reach Consistency in Trading: PART 2.
Do you want ME to help YOU with your trading?
3.) EUR/JPY sell (19.2.2020)
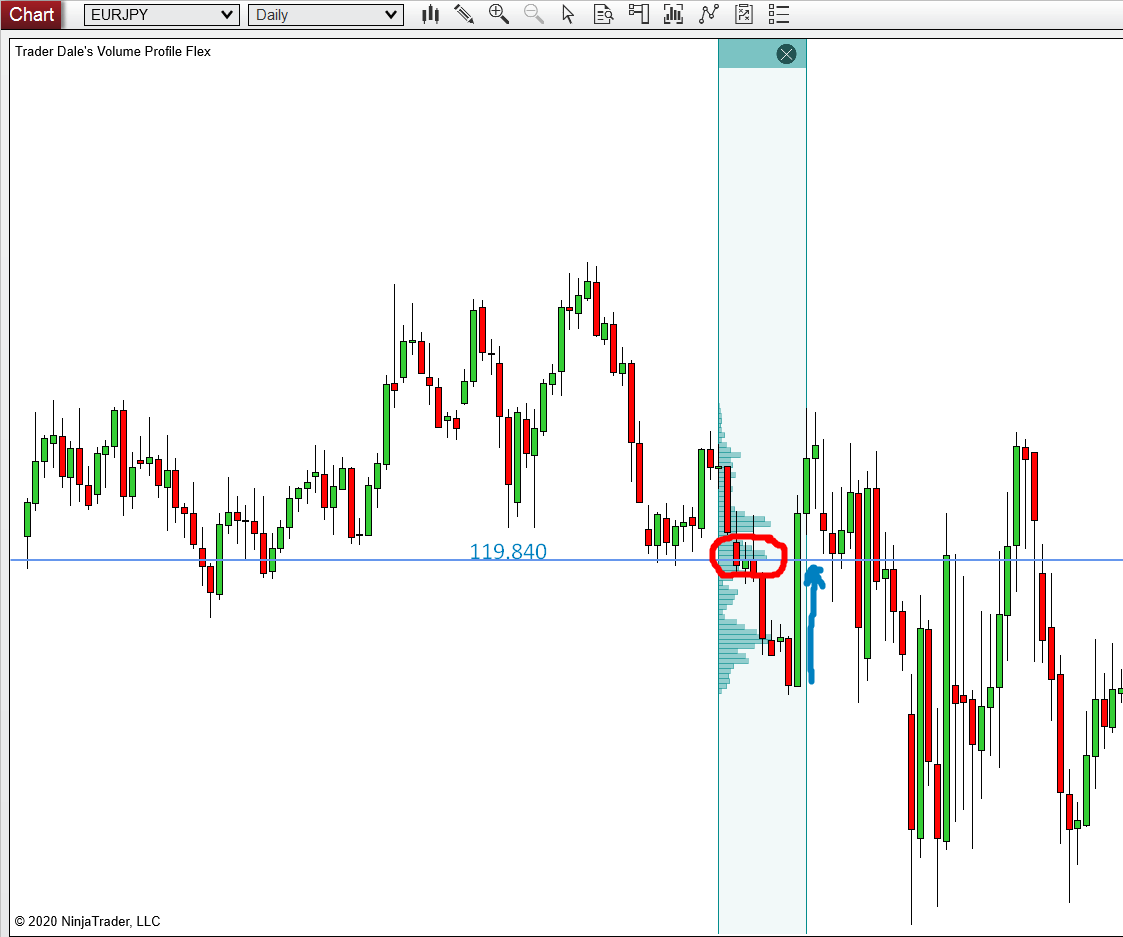
One more mistake was on this sell order from 19th February 2020.
Although there was a nice price action confirmation, the mistake this time was ignoring rapid price retracement.
This strong bullish candle completely ignored Joe’s short level. As I already said many times, the price needs to accept higher/lower price levels before returning back to the level we want to trade from. Price accepting some level means that it stays there for some time instead of quickly and strongly returning back.
This time, it was also because of huge market volatility caused by overall uncertainty around coronavirus.
When there are market uncertainties like this, fundamentals start playing a bigger role in price movements. That’s why price sometimes ignores technical analysis. In this case, the volume clusters.
4.) NZD/USD buy (20.2.2020)

‘‘What the heck is this?!”
That was my first reaction when I saw this bad trade.
There were four mistakes that Joe managed to do in just one trade.
1.) Too weak buying activity – There is one golden rule we use for identifying our levels: Volume accumulation needs to be followed by STRONG trading activity. When I say ”strong”, I mean that there are at least 2 consecutive one-way candles after the accumulation.
2.) Too weak volumes – The strength of volumes is also what separates a good trade from a bad one. In this case, volumes weren’t as significant as they should have been.
Have a look at the upper volume cluster. Although the reaction looks a bit weak, I actually managed to take a profit there. This level was also shared with my members who have access to my Swing levels section.
3.) The POC was too low – In cases where the POC is too near to one extreme of the accumulation, the price tends to shoot past it before making a reaction.
It’s because these areas consist of many pending Stop Loss orders which are together making a significant liquidity zone.
4.) Weak low – This one usually goes together with #3 – ”the POC being too low” and also the failed auctions.
I explained it all in detail in my book. As thanks for bearing this long with me here, I am giving a copy of it absolutely for FREE. Just click on the banner below and it will download instantly!

The Conclusion
It’s in the nature of people to want good things fast. That’s why things like this happen easily.
At each point of our trading, we must be sure we are trading with a proven edge. An edge stands for higher than 50% probability that something will happen.
In terms of trading, having an edge means that we have a setup with 1:1 risk to reward ratio which has more than 50% chance of ending up as a winner.
If for some reason we lower our “One Good Trade” criteria, it means that we are losing our edge and that we are starting to gamble.
It is a gamble because we don’t have a historically proven working strategy anymore. It means that we don’t know if our new way of trading still has more than 50% win rate chance.
The main lesson from this article is this:
Every time we enter a trade we must be sure that it’s historical performance showed positive results. Otherwise it is gambling.
I hope you liked this article guys. Let me know in the comments if you also had an experience like this and how you handled it!
-Dale
- Get link
- Other Apps
- Get link
- Other Apps
Comments
Post a Comment