
About two months ago I wrote an article titled “Will there be a Sell-Off on Gold?“. At that time Gold was quite overpriced and it was close to the psychological barrier of $2.000. I also wrote a bit about how Gold does not really have too much use in technology and that in most cases it is just a shiny piece of stone people like to buy.
In the two upcoming months, the predicted sell-off really came. The first one in August and then the second one in September.
In this article, I would like to show you the most important institutional support and resistances which formed on Gold.
As the institutions are best seen using Volume Profile, I will be using this indicator to identify the most important support and resistance zones.
Support at 1810.00
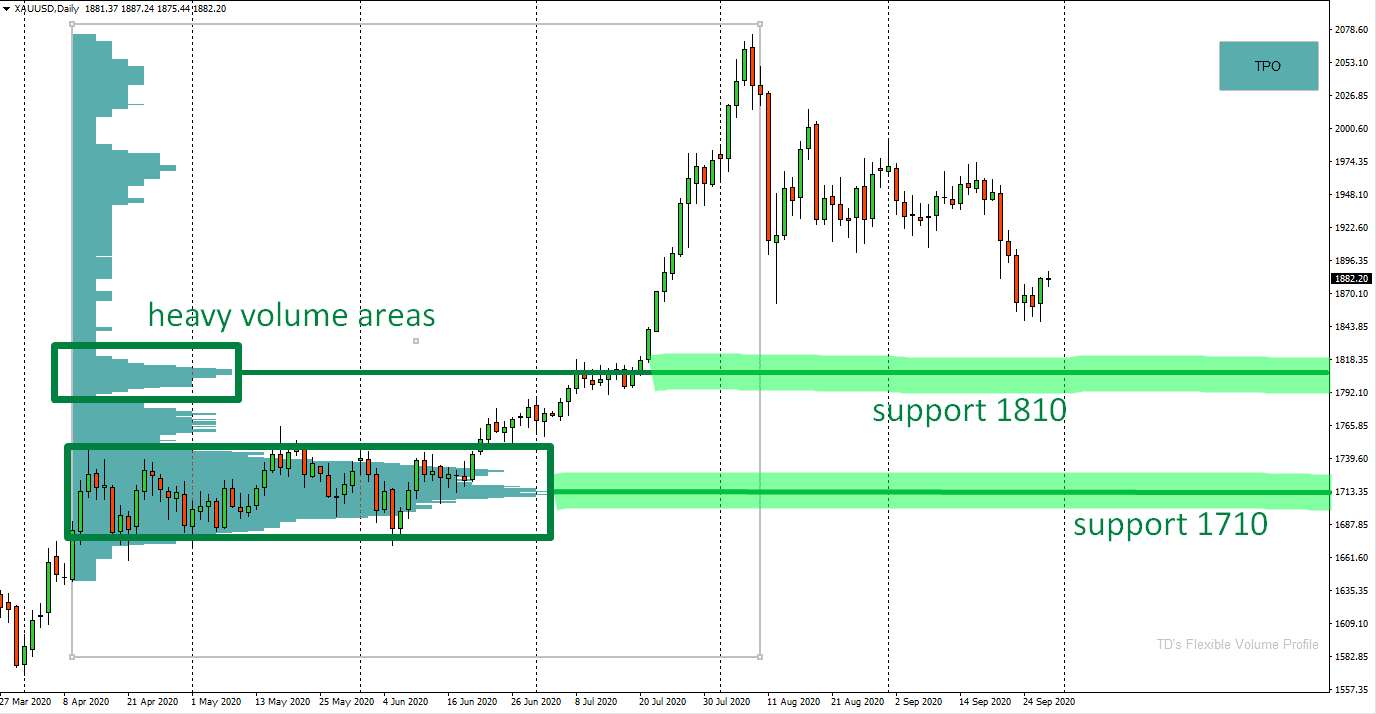
I used my Flexible Volume Profile on the whole uptrend (including the rotation that took place before it). This revealed two significant heavy volume areas.
The first one is around 1810 and it is based on a Volume Cluster from which a strong and aggressive uptrend started. This is most likely a place where the big trading institutions were adding to their long positions. When they have done so, they started to push the price aggressively upwards.
When the price makes it back into this area again those buyers could show up, defend their longs, and try and push the price upwards again.
I call this setup the “Trend Setup” because I trade it when there is a trend.
Support at 1710.00
This support is based on heavy volume area which got formed in a very long rotation. This rotation took about 3 months to form. From there the strong buying on Gold started.
Massive volumes were traded in this rotation. I believe those massive volumes were the big institutions entering their longs there.
They placed most of their positions at 1710 – this is the Point Of Control of the whole rotation.
When the price makes it back into this area I think those buyers could start buying again, defending their longs and defending this support.
I call this setup the “Volume Accumulation Setup“.
Gold, Daily chart:
Do you want ME to help YOU with your trading?
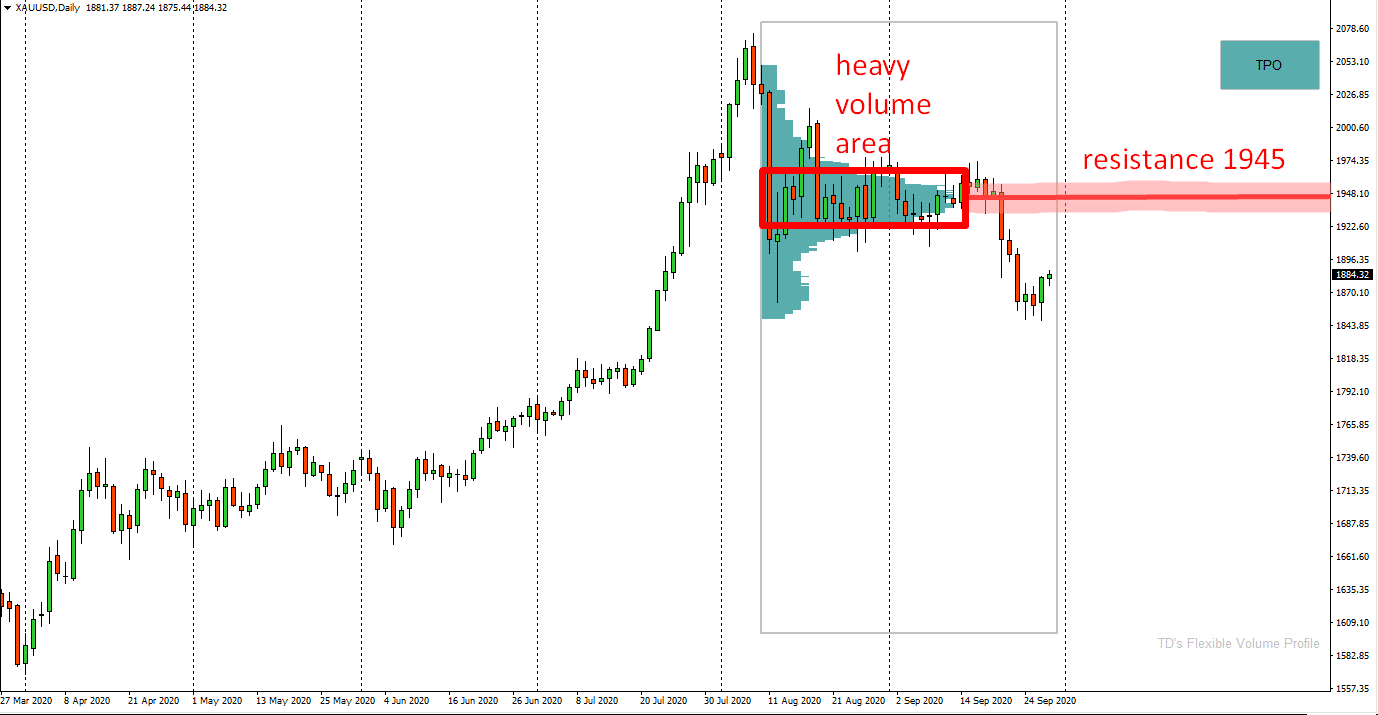
Resistance at 1945.00
This is a newly formed resistance which got formed after the recent sell-off couple of days ago.
There was a long rotation and from that rotation the selling started. I marked the rotation in red in the picture below. You can see, that there were also huge volumes traded there.
I think that those volumes were institutions entering their short trades there. When they have accumulated enough of them, they pushed the price downwards.
When the price makes it back into this area again I believe that those sellers will become active again and that they will defend this resistance. Defend how? By entering aggressive sell market orders. With them they will try to push the price downwards again.
I think that if the sell-off is to continue, this resistance needs to hold.
Gold, Daily chart:

I hope you guys liked this analysis! Let me know what you think in the comments below.
Happy trading!
-Dale
- Get link
- X
- Other Apps
- Get link
- X
- Other Apps
Comments
Post a Comment