Today, I would like to have a closer look at NZD/CAD. What caught my eye here was a strong sell-off that occurred last week (13th May).
Such a strong sell-off is a sign of aggressive sellers jumping in and pushing the price downwards.
In this case, it is pretty easy to spot where those sellers were accumulating their selling positions before they started the aggressive sell-off.
The reason is that in a rotation those sellers could easily hide their intentions (of starting a sell-off) and slowly, unnoticed accumulated their short positions.
In fact, the heaviest volumes throughout the whole week got accumulated there! (= Weekly Point Of Control).
After those volumes got accumulated → BOOM! A sell-off! It is this sell-off where the sellers were making money.
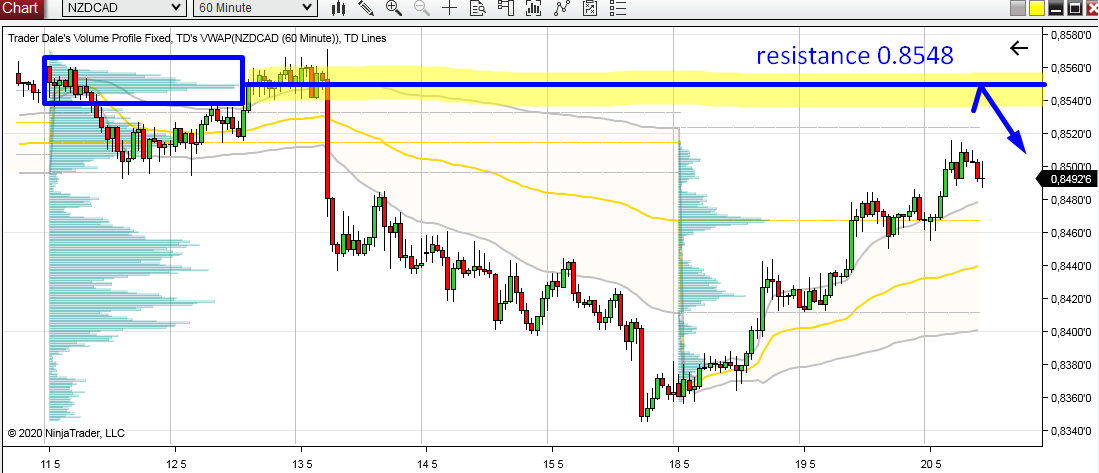
Now the price is slowly retracing back into this area (to test the Weekly POC at 0.8548).
I think that it will work as a strong resistance and that those sellers will want to defend their short positions.
It is likely, that they will start selling again and try and push the price downwards again.
Below is a 60 Minute chart of NZD/CAD with Weekly Volume Profiles:
In this case, it is pretty easy to spot where those sellers were accumulating their selling positions before they started the aggressive sell-off.
Price Action
Price Action shows that there was a rotation before the sell-off started. Such a rotation is an ideal place for position accumulation.The reason is that in a rotation those sellers could easily hide their intentions (of starting a sell-off) and slowly, unnoticed accumulated their short positions.
Volume Profile
If you look at the Weekly Volume Profile (on the left) then you can see massive volumes accumulated exactly in that rotation area.In fact, the heaviest volumes throughout the whole week got accumulated there! (= Weekly Point Of Control).
After those volumes got accumulated → BOOM! A sell-off! It is this sell-off where the sellers were making money.
Now the price is slowly retracing back into this area (to test the Weekly POC at 0.8548).
I think that it will work as a strong resistance and that those sellers will want to defend their short positions.
It is likely, that they will start selling again and try and push the price downwards again.
Below is a 60 Minute chart of NZD/CAD with Weekly Volume Profiles:

Order Flow
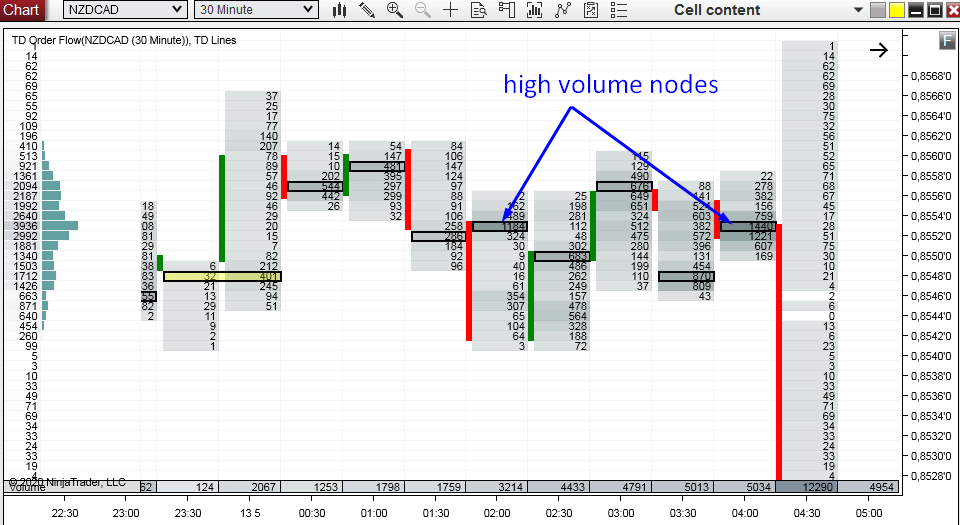
We can also identify those sellers using Order Flow!I zoomed into the rotation area which was formed before the sell-off started to show you how it looked like in there.
The thing which I think is the most important here is the High Volume Nodes. They are easy to identify (at last with my software) because they are printed in darker shades and put into a frame.
There are two especially strong ones, and the strongest one (1440) was formed just before the sell-off started.
Those were without any doubt strong sellers getting ready!
That’s a nice confirmation of the resistance we initially found using the Volume Profile! We can actually see the big guys getting ready here! Cool, right?
You know, I am really proud that we were able to make the Order Flow like this. I don’t think there is any other Order Flow software able to read Forex this way!
Below is NZD/CAD Order Flow. The footprints show 30 Minute candles and the volumes traded in them:
I hope you guys liked today’s analysis! Let me know what you think in the comments below!
Happy trading!
-Dale
Happy trading!
-Dale
PS.
You can now get my new ORDER FLOW PACK (including Order Flow software,
Order Flow Video Course, and Volume Profile Pack) here: ORDER FLOW PACK
- Get link
- Other Apps
- Get link
- Other Apps
Hey, thanks for the information. your posts are informative and useful. I am regularly following your posts.
ReplyDeleteAvanti Feeds Ltd