Yesterday,
I wrote an article about VWAP trading setups. I showed you how to use
VWAP when there is a rotation and also how to use it in a trend.
If you missed it then you can read the article here:
VWAP Trading Setups
Today, I will do an intraday analysis of the AUD/NZD and I will use VWAP and Volume Profile just the way I showed you in the article yesterday.
In this case you could also tell by just looking at the price action without using the VWAP. Sometimes it is not so clear as here though…
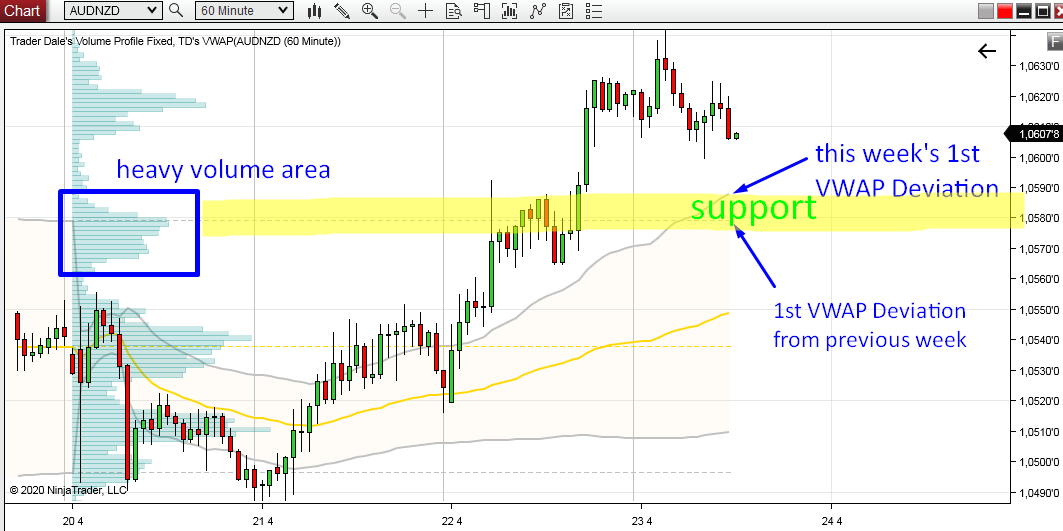
If you look at the picture below, you can see that the 1st Deviation is trending nicely and that the price is moving above it. When the price hits the 1st Deviation, then chances are there will be a buying reaction!
Another thing to notice here is that the 1st Deviation from the previous week ended very close to the area of the current 1st Deviation. This adds strength to the support.
You can also notice a significant volume area around this support on the Weekly Volume Profile. I will talk bit more about it later.
Below is a 60 Minute chart of AUD/NZD, with Weekly VWAP and Weekly Volume Profile:
If you missed it then you can read the article here:
VWAP Trading Setups
Today, I will do an intraday analysis of the AUD/NZD and I will use VWAP and Volume Profile just the way I showed you in the article yesterday.
Identify the Trend
The first thing to do is to identify whether there is a rotation or a trend. In this case it is pretty simple. The 1st VWAP deviation (Weekly VWAP) is moving upwards. This means that the price and volumes are shifting upwards and that there is an uptrend.In this case you could also tell by just looking at the price action without using the VWAP. Sometimes it is not so clear as here though…
VWAP Trend Setup
When there is a trend you want to see the price moving above the 1st Deviation and make pullbacks to it. Then you want to trade longs from those pullbacks.If you look at the picture below, you can see that the 1st Deviation is trending nicely and that the price is moving above it. When the price hits the 1st Deviation, then chances are there will be a buying reaction!
Another thing to notice here is that the 1st Deviation from the previous week ended very close to the area of the current 1st Deviation. This adds strength to the support.
You can also notice a significant volume area around this support on the Weekly Volume Profile. I will talk bit more about it later.
Below is a 60 Minute chart of AUD/NZD, with Weekly VWAP and Weekly Volume Profile:

Volume Profile analysis
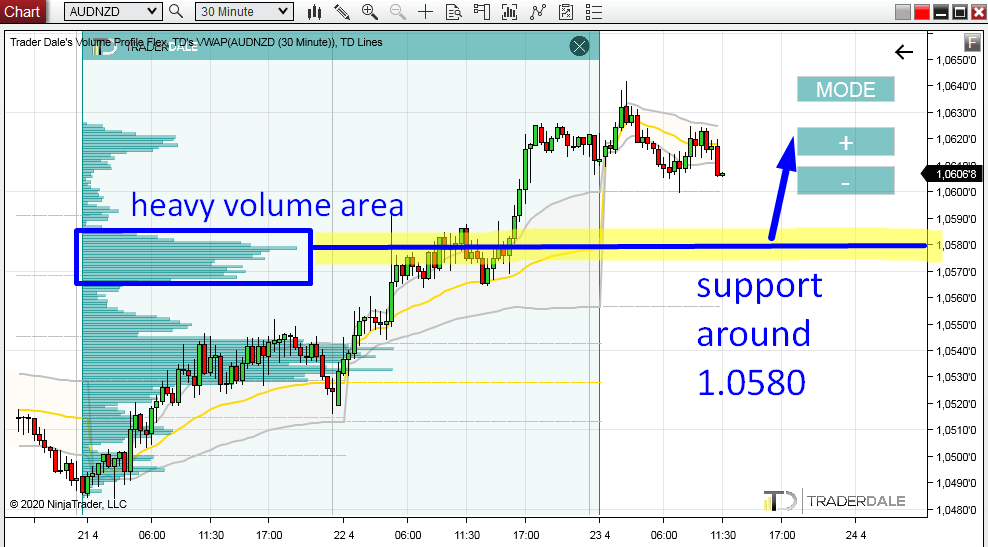
Let’s now have a look some more into the volume distribution in this trend area.I used my Flexible Volume Profile to the whole trend area to identify places where significant volumes were traded.
There are two significant volume areas visible. The first one (around 1.0580) corresponds with the support from the VWAP Trend setup (the picture above).
As the price was moving upwards, buyers were adding to their long positions in those heavy volume areas.
It is likely that when there is a pullback into those heavy volume areas, buyers will want to defend their longs and they will try to push the price upwards from those areas again.
Below is 30 Minute chart of AUD/NZD with Flexible Volume Profile:
What I like about all this the most is the confluence. 1st VWAP Deviation points us to a trading level and Volumes point us to the same place too!
This is how I like to use VWAP and the Deviations – as a combo with the Volume Profile. That’s where the VWAP strategies shine the most!
This is how I like to use VWAP and the Deviations – as a combo with the Volume Profile. That’s where the VWAP strategies shine the most!
I hope you guys liked today’s analysis! Let me know what you think in the comments below!
Stay safe and happy trading!
-Dale
Stay safe and happy trading!
-Dale
- Get link
- X
- Other Apps
- Get link
- X
- Other Apps
Hey, thanks for the information. your posts are informative and useful.
ReplyDeleteGenus Prime Infra Ltd