My favorite way to use the VWAP indicator is to use it in a combination with Volume Profile or with Price Action setups.
Sure,
you can use VWAP as a standalone strategy, but it shines the most when
you combine it with some other trading strategy you like. For me, the golden combination is VWAP + Volume Profile or VWAP + Price action setups.
In today’s article, I would like to show you how I combine VWAP with other trading strategies. I will show you three trading examples. All those in just one chart!
In today’s article, I would like to show you how I combine VWAP with other trading strategies. I will show you three trading examples. All those in just one chart!
EXAMPLE #1: VWAP + Volume Profile
The picture below shows NZD/USD; 60 Minute chart.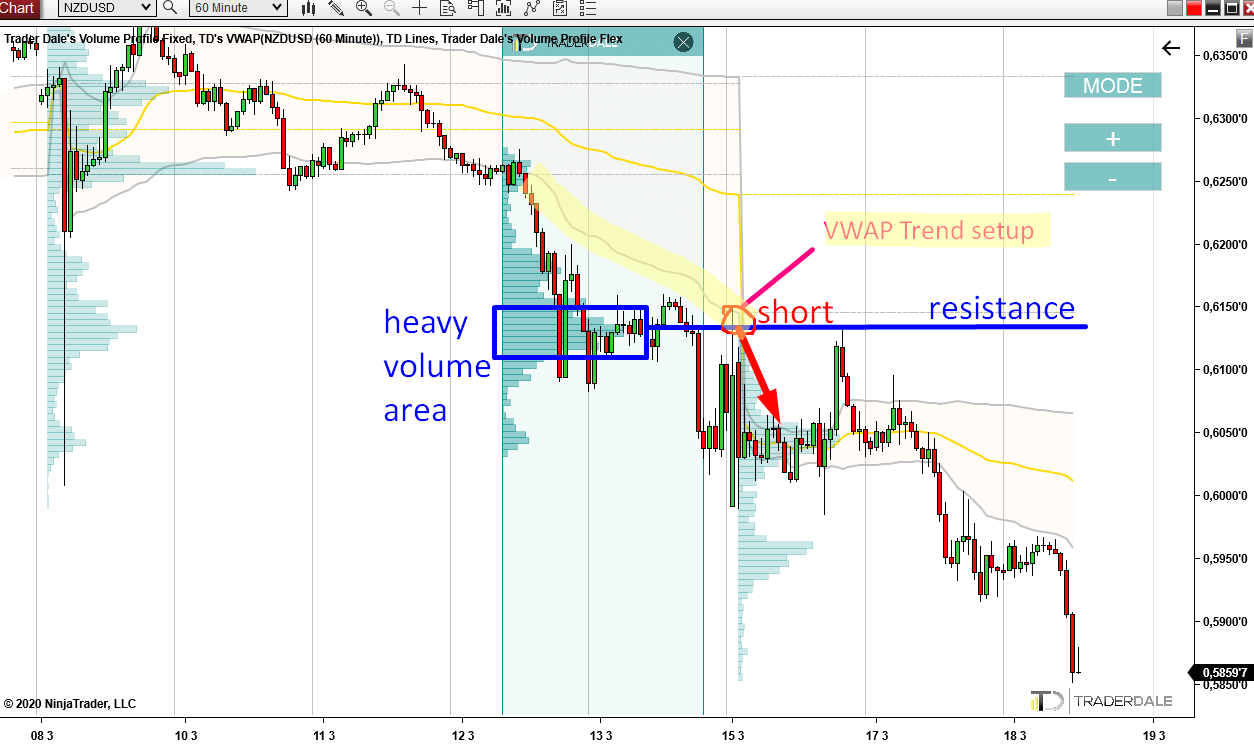
In here I am using the VWAP Trend Setup. I use this setup when there is a trend. The price needs to move below the 1st deviation of VWAP (grey line which I highlighted in yellow). When there is a pullback and the price hits this the 1st Deviation, then it is a signal to go short.
There was also a heavy volume area from which a strong selling activity initiated (marked in blue rectangle). This gives me the information that the heavy volumes are most likely heavy volumes of strong and aggressive sellers. They were adding to their selling positions and then they pushed the price downwards. The heaviest peak in this Volume Cluster is a strong Resistance. The reason for that is when the price makes it back to this level again (it actually did later that day), then the sellers from this area will try and push the price downwards again (to defend their selling positions).
If you look at the picture you can see that those two short signals met almost at the same price level. This means two completely independent trading setups gave a short signal at the same price level. This is the kind of confluence I want to trade!
As you can see, the price nicely reacted to this double resistance area and went downwards almost immediately.
EXAMPLE #2: VWAP + Price Action
The picture below shows NZD/USD; 60 Minute chart (the same chart as before).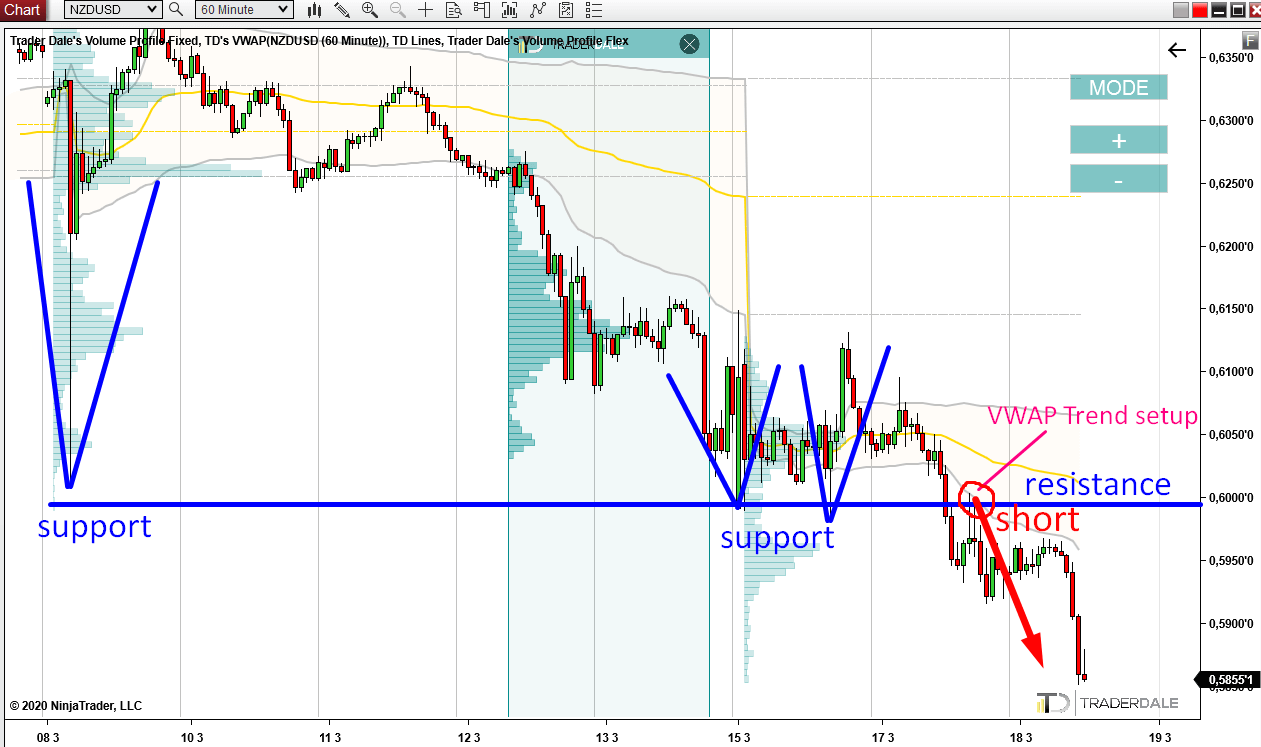
In this chart, we also have the VWAP Trend setup. The price is moving downwards and the 1st VWAP Deviation is heading downwards too. As in the previous picture, here too we want to see a pullback to this grey line for a short trade signal. As you can see this pullback occurred just yesterday!
Apart from the VWAP short signal, there is also a Price Action short signal. This one is based on a strategy which says that a level which worked as a support in the past will work as a resistance when the price gets below it. This is a pretty old but good Price Action strategy. You can learn more about it in this article:
Support becoming a resistance (and vice versa)
As you can see from the picture the short trading signal from VWAP meets with the short trading signal from the Price Action strategy. They meet at the same price level and the price reacts to this double-short signal very nicely.
EXAMPLE #3: VWAP + Volume Profile
The picture below shows NZD/USD; 60 Minute chart (the same chart as before).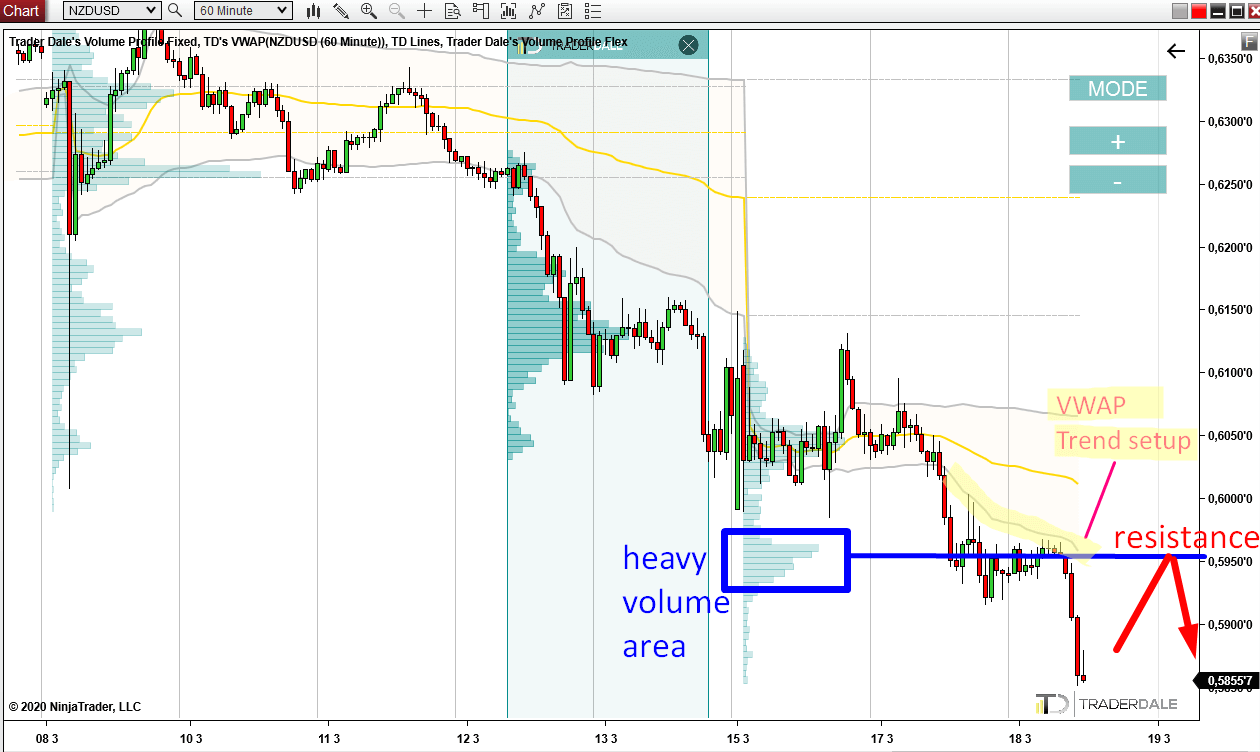
The last example is actually pretty similar to the first one. There is the VWAP Trend setup: The 1st deviation (highlighted grey line) is moving downwards and the price moves below it. Now we are waiting for the price to hit the 1st Deviation from below. When it does, then it will be a signal to sell.
At the same area where the 1st VWAP deviation currently is, there is also a heavy volume area. This tells me that strong sellers were adding to their selling positions there. As you can see another strong selling activity started from this place. Because of this I think that when the price makes it back to this area again, those sellers will try and defend their selling positions. They will start aggressive selling to push the price downwards again.
So, we have two sell signals around the 0.5950 level. When the price gets there again, I think there is a pretty solid chance that it will react there and go downwards again.
So, don’t risk too much on one single trade. No matter how much you trust it, no matter haw many confluences there are… Because the market will most likely find a way to surprise you. Murphy’s law in trading is that the market usually surprises you when you believe too much in a single trade trade and risk too much on it 🙂
At the same area where the 1st VWAP deviation currently is, there is also a heavy volume area. This tells me that strong sellers were adding to their selling positions there. As you can see another strong selling activity started from this place. Because of this I think that when the price makes it back to this area again, those sellers will try and defend their selling positions. They will start aggressive selling to push the price downwards again.
So, we have two sell signals around the 0.5950 level. When the price gets there again, I think there is a pretty solid chance that it will react there and go downwards again.
No matter how many confluences – Don’t risk too much!
There is one important thing I would like to say to wrap up this article. The thing is that there is no trading strategy that would be working in 100% of the cases. In fact, if you have a strategy which has around 60-65% win rate in the long run, then you actually belong to a very small group of very good traders!So, don’t risk too much on one single trade. No matter how much you trust it, no matter haw many confluences there are… Because the market will most likely find a way to surprise you. Murphy’s law in trading is that the market usually surprises you when you believe too much in a single trade trade and risk too much on it 🙂
I hope you guys liked this article! Let me know what you think in the comments below!
Happy trading!
-Dale
Happy trading!
-Dale
- Get link
- X
- Other Apps
- Get link
- X
- Other Apps
Comments
Post a Comment