Major stock indices are falling every day to new lows. Such a strong market crash wasn’t here for decades! As traders, I think we need to keep our heads clear and start looking for some nice trading opportunities. Stocks are getting cheaper and more attractive every day!
This one correlates with all the other major indices and also falls to new lows every day. It won’t be falling forever though! The underlying asset for this index are the strongest US companies. US government won’t let those fall (not while the US central bank can print money indefinitely).
As an investor, I am looking for buying opportunities now. I want to buy those strong companies cheaply!
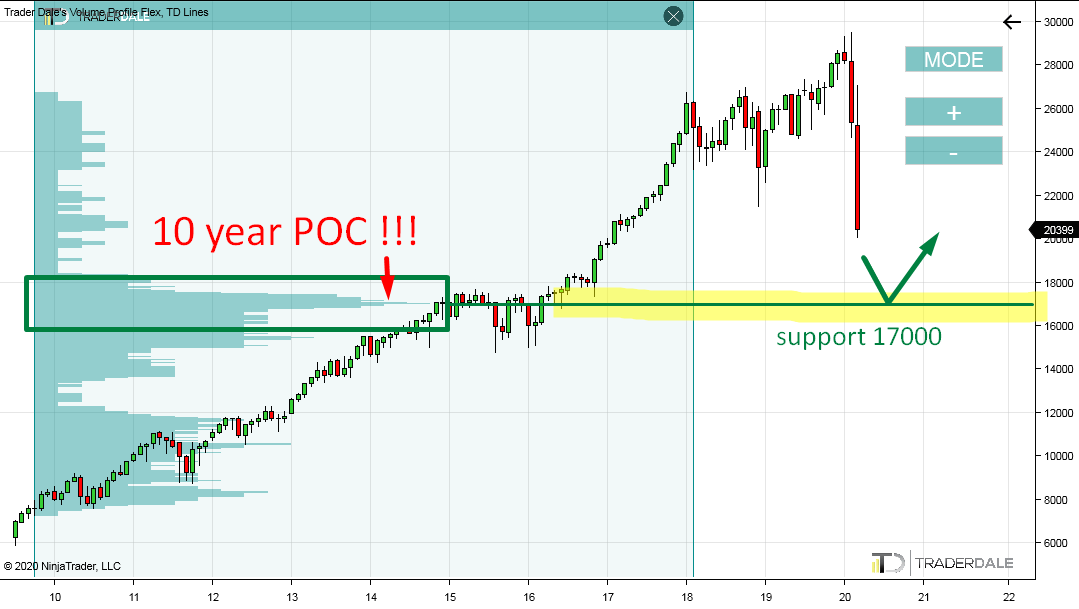
What I did here was that I used my Flexible Volume Profile over the uptrend area which took place in the last 10 years. That’s an insane amount of data so I used a Monthly chart to simplify things.
The Volume Profile revealed that the heaviest volumes got traded in a rotation around 17000, which took place in 2015 and 2016.
This heavy volume area is a 10-year POC (Point Of Control)! Heaviest volumes in this whole 10 year uptrend were traded there! I cannot really imagine a more significant information than this!
Dow Jones futures index; Monthly chart below:
Dow Jones index
In today’s market analysis I would like to have a look at the Dow Jones index, the world’s most famous stock index.This one correlates with all the other major indices and also falls to new lows every day. It won’t be falling forever though! The underlying asset for this index are the strongest US companies. US government won’t let those fall (not while the US central bank can print money indefinitely).
As an investor, I am looking for buying opportunities now. I want to buy those strong companies cheaply!
Volume Profile analysis
The simplest way to identify strong support/resistance is to use the Volume Profile indicator and look for heavy volumes. It is as simple as that.What I did here was that I used my Flexible Volume Profile over the uptrend area which took place in the last 10 years. That’s an insane amount of data so I used a Monthly chart to simplify things.
The Volume Profile revealed that the heaviest volumes got traded in a rotation around 17000, which took place in 2015 and 2016.
This heavy volume area is a 10-year POC (Point Of Control)! Heaviest volumes in this whole 10 year uptrend were traded there! I cannot really imagine a more significant information than this!
Dow Jones futures index; Monthly chart below:
10 year POC
What it tells me is this: there was a crazy strong uptrend. In the middle of it the buyers who were pushing the price upwards started to add to their buying positions massively (Who sold them? The guys who thought the uptrend was over). Then the buyers started another aggressive buying which drove the price in a new uptrend again. US central bank pumping free money into the economy helped the buying activity massively!So, now strong buyers have a ton of buying positions which they bought around 17000. What they do when the price hits this level again (maybe in the very near future)?
I think they will decide to fight. This means they will start aggressive buying again. This could stop the crazy selloff we see right now and quite possibly turn it into a new uptrend.
Come on Dale…10 year old volumes? Really?…
Sometimes I am getting messages like: ” Do you really believe 10 years old volumes will have any impact on the current price development?“I absolutely do! Check this out:
It is an analysis I posted here a month ago:
A MAJOR Resistance on Gold
What I predicted was a selloff on Gold from 1665 area. This prediction was based on volumes created 9 years ago!
This is the prediction I posted here:

This is the result:
The strongest sell-off since 2013!
Is there any other indicator capable of this? I don’t think so!
The strongest sell-off since 2013!
Is there any other indicator capable of this? I don’t think so!

Did you guys like this analysis? Do you agree? Let me know what you think in the comments below!
Happy trading!
-Dale
Happy trading!
-Dale
- Get link
- X
- Other Apps
- Get link
- X
- Other Apps
ReplyDeleteHey, thanks for the information. your posts are informative and useful.
Hitech Corporation Ltd
Thanks for sharing valuable information
ReplyDeleteShriram Transport Finance Co. Ltd
Oberoi Realty Ltd