Today I would like to do a swing trade analysis of the USD/JPY and show you some points that I think are pretty important there.
What also happened here was that 10 months old gap got closed as a result of this buying activity.
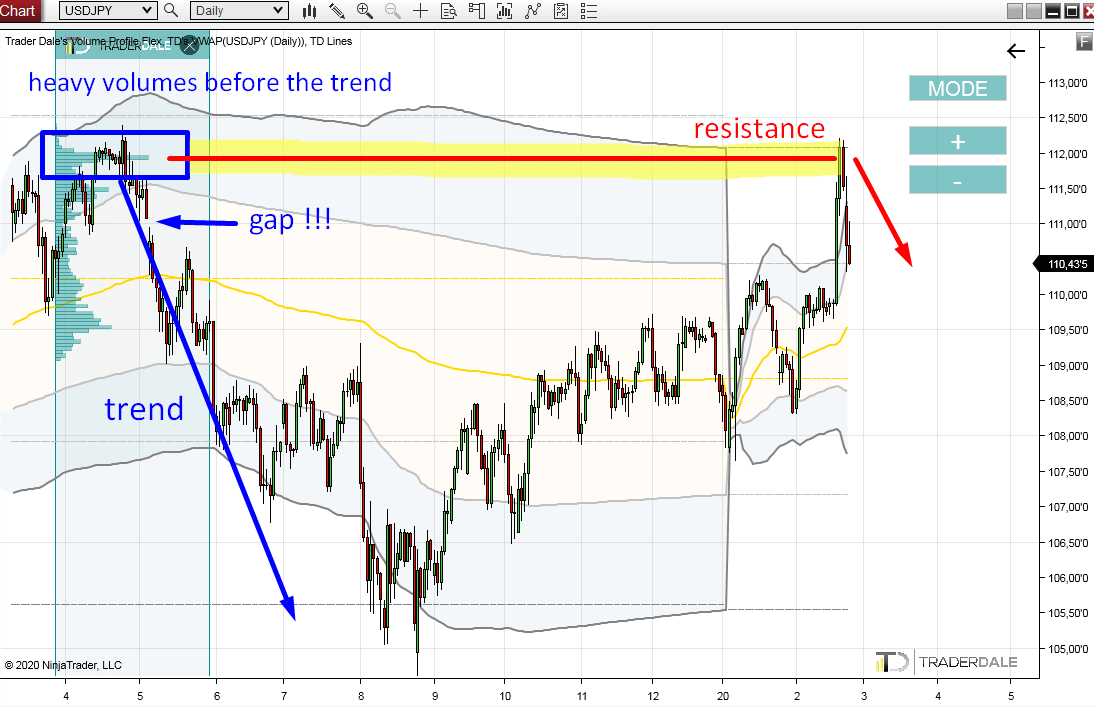
Gaps on forex are pretty important for two reasons. First, they tend to get closed soon. Second, if they don’t get closed, then there is likely to be a trend. This happened on the USD/JPY in 2019. There was a gap which did not close and this started a new strong downtrend.
More about trading gaps here:
How to trade gaps
Why did that happen? One word – Volumes.
Back in 2019, there was a Volume accumulation right before the new downtrend started. There were clearly strong sellers building up their selling positions.
After they accumulated their selling positions they pushed the price aggressively downwards. They were so strong, that buyers were not even able to close the gap I mentioned before.
Now, after 10 months the price went back into this area again.
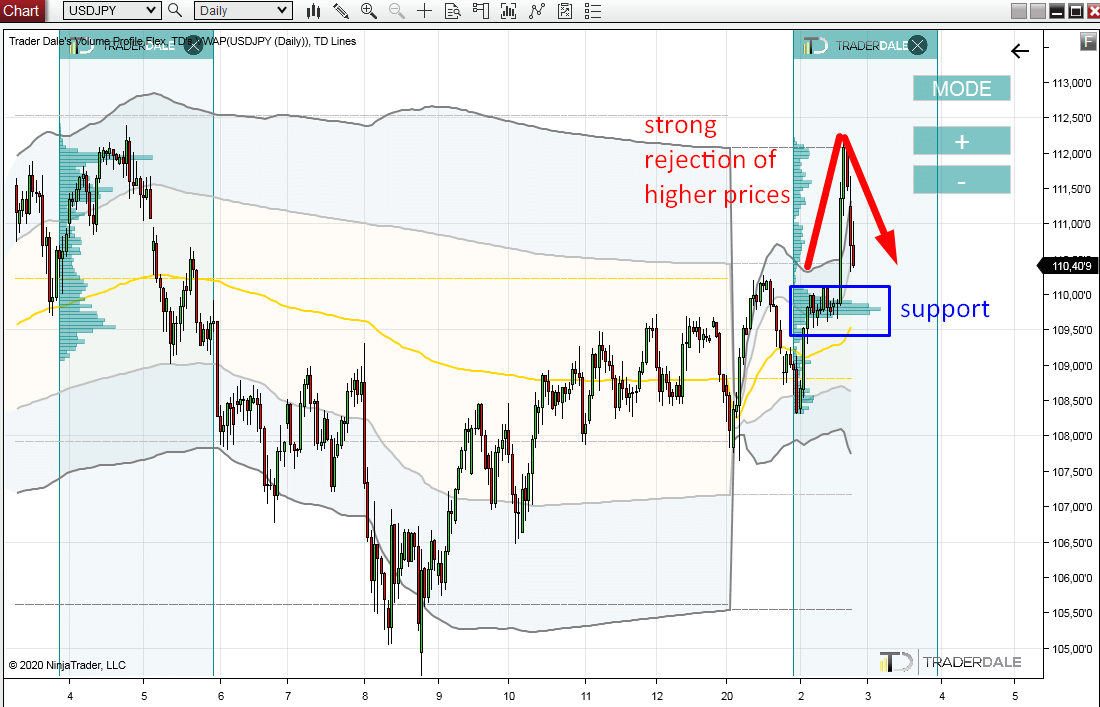
What happened few days ago is that sellers from 2019 became active again and started an aggressive selling activity.
What I also think happened is that the buyers who were pushing the price upwards recently started to get rid of their long positions (because they saw the aggressive sellers from 2019 becoming active again). When a buyer closes his position he SELLS. This helps to drive the price downwards.
Those were the two factors that turned the price so sharply.
Crazy USD/JPY buying
There was some pretty aggressive buying on the USD/JPY recently. The price shot 240 pips upwards just in two days!What also happened here was that 10 months old gap got closed as a result of this buying activity.
Gaps on forex are pretty important for two reasons. First, they tend to get closed soon. Second, if they don’t get closed, then there is likely to be a trend. This happened on the USD/JPY in 2019. There was a gap which did not close and this started a new strong downtrend.
More about trading gaps here:
How to trade gaps
Sudden price reversal
So, we have a gap closed and strong buying activity. Then the price suddenly turned.Why did that happen? One word – Volumes.
Back in 2019, there was a Volume accumulation right before the new downtrend started. There were clearly strong sellers building up their selling positions.
After they accumulated their selling positions they pushed the price aggressively downwards. They were so strong, that buyers were not even able to close the gap I mentioned before.
Now, after 10 months the price went back into this area again.
What happened few days ago is that sellers from 2019 became active again and started an aggressive selling activity.
What I also think happened is that the buyers who were pushing the price upwards recently started to get rid of their long positions (because they saw the aggressive sellers from 2019 becoming active again). When a buyer closes his position he SELLS. This helps to drive the price downwards.
Those were the two factors that turned the price so sharply.
What now?
Now, after the sudden price reversal, the price is heading towards a newly formed Volume Cluster. Under normal circumstances, such Volume Cluster would be nice support to go long from.What is pretty risky in this particular situation is the strength of the rejection that we see on USD/JPY right now.
In other words – this Volume Cluster would be a pretty nice level to trade only of the price didn’t do what it just did – sharp reversal almost immediately after this Volume Cluster got formed.
I am not saying that this support won’t hold but I think longs in such situations are really risky and not really worth it.
The point is that it is generally better not to trade every Volume Cluster blindly, but to look at what is going on in the market and filter out the most risky trades.
I hope you guys liked the article. Let me know what you think in the comment section below!
I hope you guys liked the article. Let me know what you think in the comment section below!
Happy trading!
-Dale
-Dale
- Get link
- X
- Other Apps
- Get link
- X
- Other Apps
Hey, thanks for the information. your posts are informative and useful.
ReplyDeleteInd-Swift Laboratories Ltd