In yesterday’s post, I was talking about intraday resistance on USD/JPY.
I said it was a bit risky scenario because this resistance went against
a long-term uptrend (therefore it was a counter trend resistance).
Today, I would like to look more into the big picture of USD/JPY and comment on the strong long-term uptrend.
Today, I would like to look more into the big picture of USD/JPY and comment on the strong long-term uptrend.
How to enter a trade in a trend
When I see a strong trend, I always look for ways how to jump in the trend and participate in it.
I never jump in it without giving it a thought. I always wait for a pull-back before I enter the trade.
In other words – I never enter long when the price is at it’s highs (as well as I never enter shorts when the price is at it’s lows).
The price went through a pretty significant area and now it rotates above it.
This area is around 109.70.
Why is it a significant area? Because in the past, the price reacted to it several times. This level worked as a strong SUPPORT as well as a strong RESISTANCE.
I never jump in it without giving it a thought. I always wait for a pull-back before I enter the trade.
In other words – I never enter long when the price is at it’s highs (as well as I never enter shorts when the price is at it’s lows).
A significant area on USD/JPY
So, let’s have a look at the USD/JPY now. If you look at the Daily chart, you can see strong buyers pushing the price up.The price went through a pretty significant area and now it rotates above it.
This area is around 109.70.
Why is it a significant area? Because in the past, the price reacted to it several times. This level worked as a strong SUPPORT as well as a strong RESISTANCE.
Support becomes a Resistance, Resistance becomes a Support…
When a SUPPORT gets breached, it then becomes a RESISTANCE. The same goes the other way – if a RESISTANCE gets breached, then it becomes a SUPPORT.If this concept is totally new for you, you can read my article about it:
Price Action Strategy: Support Becoming Resistance
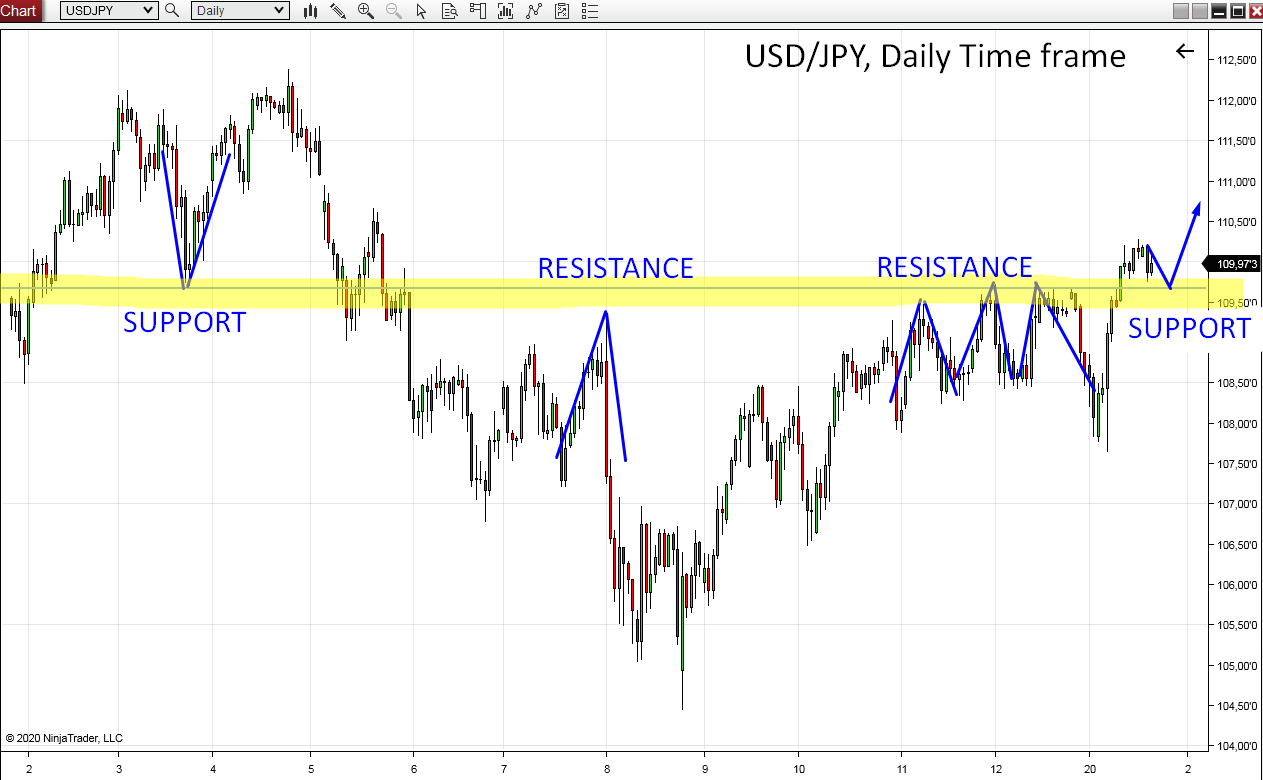
Let’s now have a look at the picture. It is a USD/JPY Daily chart, and the strong level (around 109.70) is highlighted in yellow. I also marked places where the price had strong reactions to this level in the past.
As you can see, at first the level worked as a strong SUPPORT (the price bounced upwards from it). Then the price went below this level, and reacted to it from below (level worked several times as a RESISTANCE).
Now the price went through the level again and this former RESISTANCE became a SUPPORT again!
What’s next?
It will be very interesting to watch how the price will react to this level when it hits it again. I think that it is pretty likely, that it will work as a SUPPORT again and the price will react to it and go up again.
Remember,
this trading opportunity is on a Daily chart. So if you decide to trade
this, or any other trading scenario based on Daily charts – you need to have adequate Stop-Loss (for example 50 pips). You need to let the trade breathe – because it is a swing trade, not an intraday trade.
BONUS: An ideal scenario
In this
case there is only the Price Action setup (Resistance which turned into a
Support). There is no other confirmation to this level.
Ideal scenario would be, if there also was a Volume Cluster created at the level (unfortunately, in this case there is no significant Volume Cluster).
Here is an article where you can learn more about this “Ideal scenario” and Volume Cluster which confirms a level:
Ideal scenario trade – A story of a +1.600 pip trade
Happy trading!
-Dale
-Dale
- Get link
- X
- Other Apps
- Get link
- X
- Other Apps
Comments
Post a Comment