Having the "perfect" time frame is absolutely crucial. That's at least what most novice traders think. Why do they think so? Because the majority of traders use Price Action or simple trading indicators without discretion! The information they are getting from their charts is, however, always based on the time frame they chose. Isn't this a bit weird, if you think about it? In my opinion, it IS! Wouldn't it make more sense if the market was "telling" us the same thing regardless of the time frame?
One of the reasons I like trading with the Volume Profile is that with this tool, the market IS telling us the same thing. It is telling us the same thing on many different time frames. It is because the volumes and significant volume zones don't change with different time frames! Have a look at these examples:
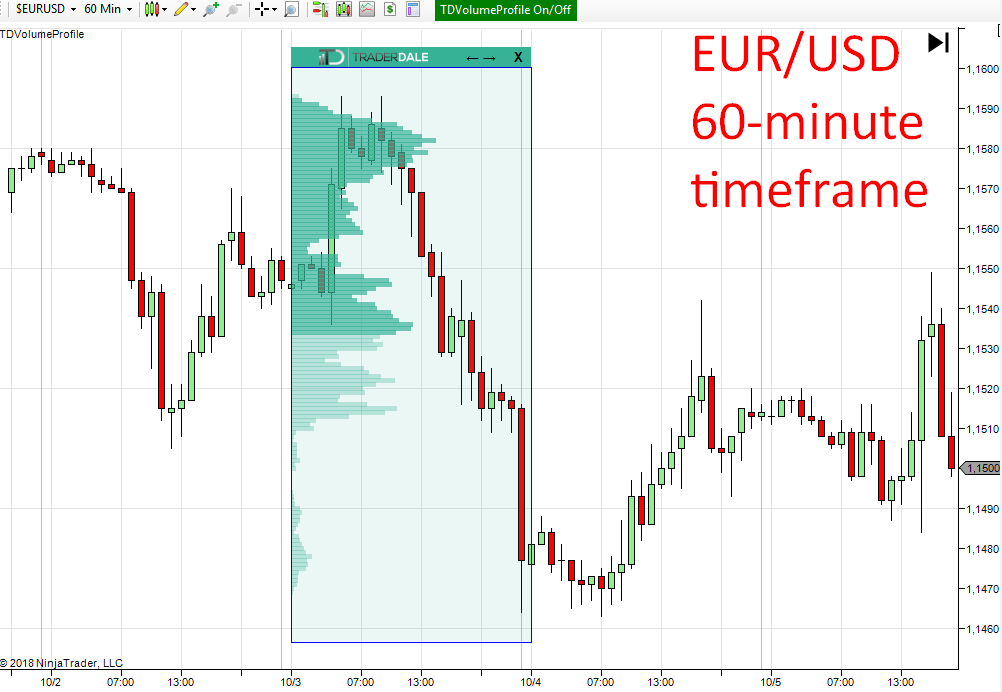
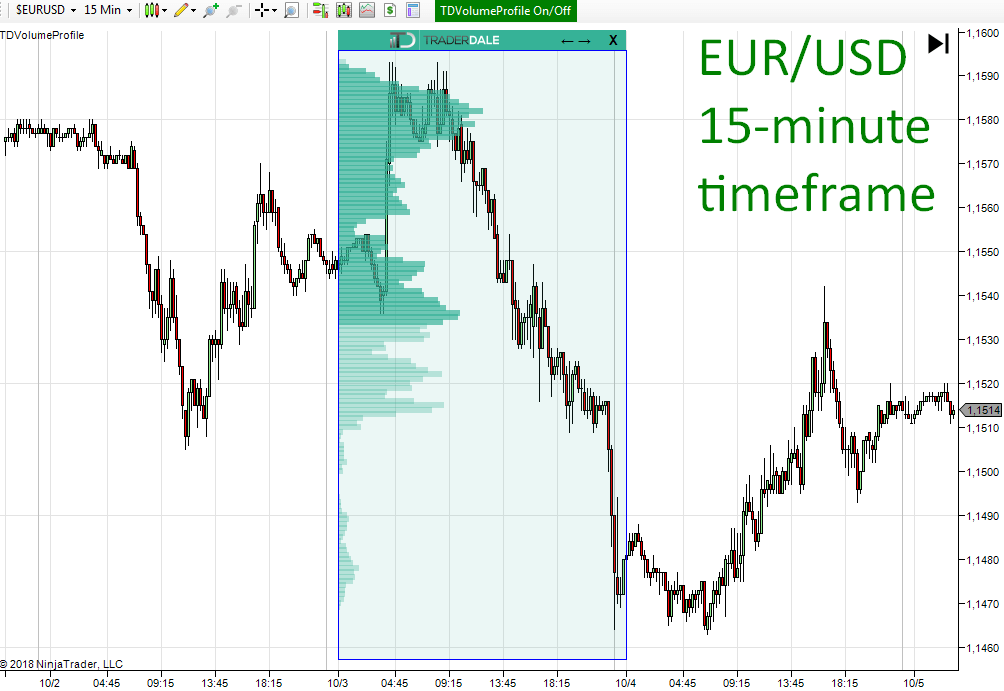
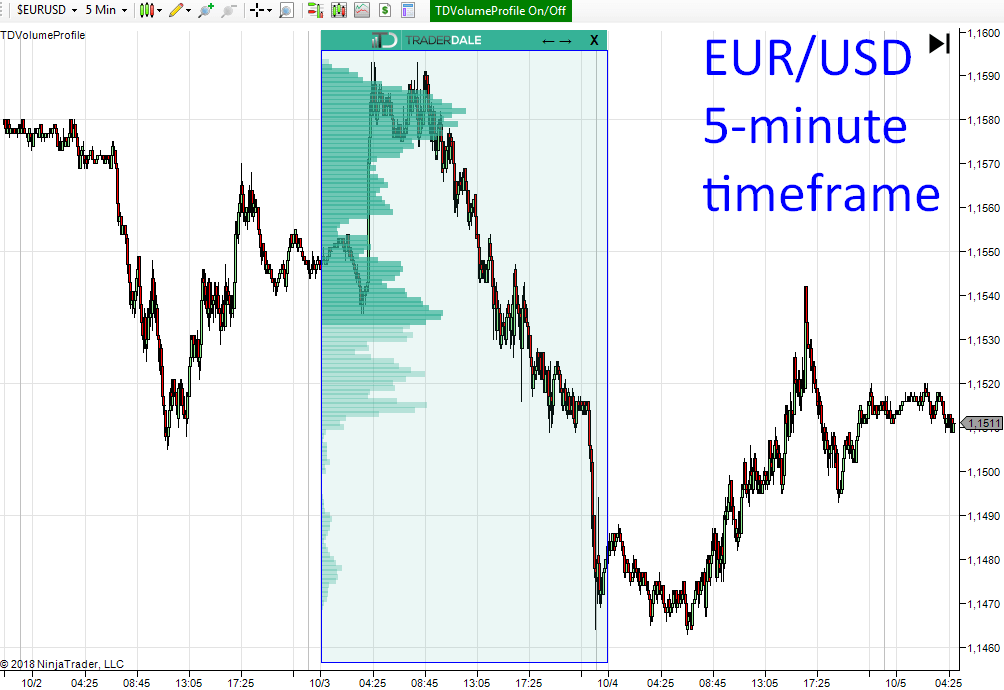
See? The Volume Profile shape doesn't change. The only thing changing is the candles. The volume-based support/resistance zones remain the same.
If you know the setups that I trade, then you know that I look for significant Price Action places. To those, I then apply the Flexible Volume Profile tool. Those significant Price Action places are Price channel/rotation, the Trend and the Aggressive rejection. You need to look for those significant Price Action areas on relevant time frames. Let's now have a look at the relevant time frames specific for each style of trading.
*If you have no clue what my setups are and what I am talking about with the significant Price Action places, then you can learn it quickly in this recording of my Volume Profile Webinar. Or you can learn it more in detail in my new book: Volume Profile: The insider's guide to trading.
It is best to look for intraday setups within the lower time frame range. A good time frame for intraday trading is somewhere within the 5-minute to 1-hour charts. It doesn't really matter to the functionality of the volume-based strategies which time frame from this range you chose. If you chose any time frame from the 5-minute to the 1-hour range and you should be fine.
It doesn't matter if you chose the 5-minute time frame or 1-hour time frame? Because the volumes will still show you the same information. Only the candles will change. You just need to be able to see the significant Price Action areas I spoke of. You will be able to spot them easily on all the time frames within the 5-minute to 1-hour range.
What is the benefit of this? Simply put, seeing the bigger picture tells you if it is better to look for long trades or for short trades. Currently, I favorize shorts on the EUR/USD, because the pair is in a downtrend (from the Daily time frame point of view).
However, it is also important to know how the volumes were distributed throughout a longer period of time - for example, a whole week. I personally always look at a Weekly profile, even when I am looking for intraday levels. Why? Because the weekly profile shows me the bigger picture and the best trading levels are usually those, that are also visible on the weekly/accumulative profile (= bigger picture).

TIP: Don't know how to create a Weekly profile? Simply stretch the Flexible Profile over the last 5 trading days (or from Monday to the current day of the week). If the price moves away from the current week's range, it is also good to view the previous week's volumes. Despite they are a bit older, the price is likely to react on those volumes too.
Significant swing levels should be visible on higher time frames. If they aren't, then they are not so significant. If you are trading my volume-based strategies, then you should be analyzing charts in time frames around 4-hour to 1-week. I personally prefer 1-day charts for my swings.
Just pick any time frame from this higher range and start looking for the significant Price Action places (Price channel/rotation, the Trend and the Aggressive rejection). Then apply the Flexible Profile to those places, and it will point you to the best trading levels.
Watching Weekly or Monthly charts as an addition to your swing analysis on 4-hour or 1-Day charts doesn't hurt. Still, it is not entirely necessary. At least in my opinion.
Below is a Daily chart of USD/CHF. There is the Volume accumulation setup visible on the right side of the chart. This alone is a strong swing level to go short from. Additionally, the level is also placed in strong volume zone visible on the cumulative Profile (last 12 months). That's the ideal trade scenario.

*Don't know how to create a Yearly or a cumulative profile? Then use the Flexible Volume Profile and stretch it over the whole current year to get the Yearly Profile. If there are only a few months in the current year, then you want to stretch the Flexible Profile over a larger area - for example the last 5-12 months ( = this is the cumulative Profile).
I found out that many traders get scared when they are in a trade, and there is a resistance standing in the way of their trade. It is absolutely okay to quit your trade when it hits a resistance. It is usually better than to take the risk and possibly turn from green numbers to the red. However, to quit your trade like this, the resistance needs to be visible on the same time frame you used to create your level. This means that the "strength" of the resistance can match the strength of your level. Let me give you a crazy extreme example to demonstrate this:
This is obviously an exaggerated example. Still, traders often quit good trades based on strong levels just because they get scared by some minor resistance on lower time frames.
Remember: if you created your trading level on the Daily time frame, then you can quit the trade only on a resistance which is also formed on a Daily time frame (or on your predetermined Profit Target, of course).
If you are trading Intraday trades and you did your analysis on the 30-minute time frame, then don't quit because something on 1-minute time frame scared you. You can quit the trade only if there is a resistance from 30-minute time frame standing in your way.
There will always be some resistance in your way. Sometimes weaker, sometimes stronger. In order to make a profit, you need to hold your positions through the weaker ones.
Happy trading
-Dale
P.S. – If you would like my Daily and Swing Levels so that you can start ‘Earning While You Learn,’ then check out our Advanced Volume Profile Training Course and Members Forum for more information – Click Here to Start Learning Now
P.P.S. I have just released a new book: VOLUME PROFILE: The insider’s guide to trading. I put a ton of work into it and I am sure it will prove extremely helpful to you. Go and get your copy HERE. I guarantee you that this will be the best $4.99 you ever spent.
One of the reasons I like trading with the Volume Profile is that with this tool, the market IS telling us the same thing. It is telling us the same thing on many different time frames. It is because the volumes and significant volume zones don't change with different time frames! Have a look at these examples:
See? The Volume Profile shape doesn't change. The only thing changing is the candles. The volume-based support/resistance zones remain the same.
Why is the Time Frame important?
Now the question is: "Why do we even care about the time frame then?" There is one area where we DO need to care about the time frame - at least a little bit. We need to use the proper time frame when we look for places to use the Flexible Volume Profile.If you know the setups that I trade, then you know that I look for significant Price Action places. To those, I then apply the Flexible Volume Profile tool. Those significant Price Action places are Price channel/rotation, the Trend and the Aggressive rejection. You need to look for those significant Price Action areas on relevant time frames. Let's now have a look at the relevant time frames specific for each style of trading.
*If you have no clue what my setups are and what I am talking about with the significant Price Action places, then you can learn it quickly in this recording of my Volume Profile Webinar. Or you can learn it more in detail in my new book: Volume Profile: The insider's guide to trading.
Relevant Time Frames for Intraday trading
Intraday trades are trades that you open and close within one day. They last from few minutes to few hours. A typical range of an intraday trade could be somewhere between 5 and 20 pips on major Forex pairs (EUR/USD, AUD/USD, USD/JPY, USD/CAD, USD/CHF...).It is best to look for intraday setups within the lower time frame range. A good time frame for intraday trading is somewhere within the 5-minute to 1-hour charts. It doesn't really matter to the functionality of the volume-based strategies which time frame from this range you chose. If you chose any time frame from the 5-minute to the 1-hour range and you should be fine.
It doesn't matter if you chose the 5-minute time frame or 1-hour time frame? Because the volumes will still show you the same information. Only the candles will change. You just need to be able to see the significant Price Action areas I spoke of. You will be able to spot them easily on all the time frames within the 5-minute to 1-hour range.
The Bigger Picture (in Intraday trading)
It is very important to keep in mind the bigger picture. Especially with the intraday trades. The bigger picture tells you two things. First, it tells you if there is a trend or a rotation on the higher time frames. Secondly, it tells you where and how the volumes were distributed throughout a longer period of time (for example throughout the whole week).Price on higher Time Frames
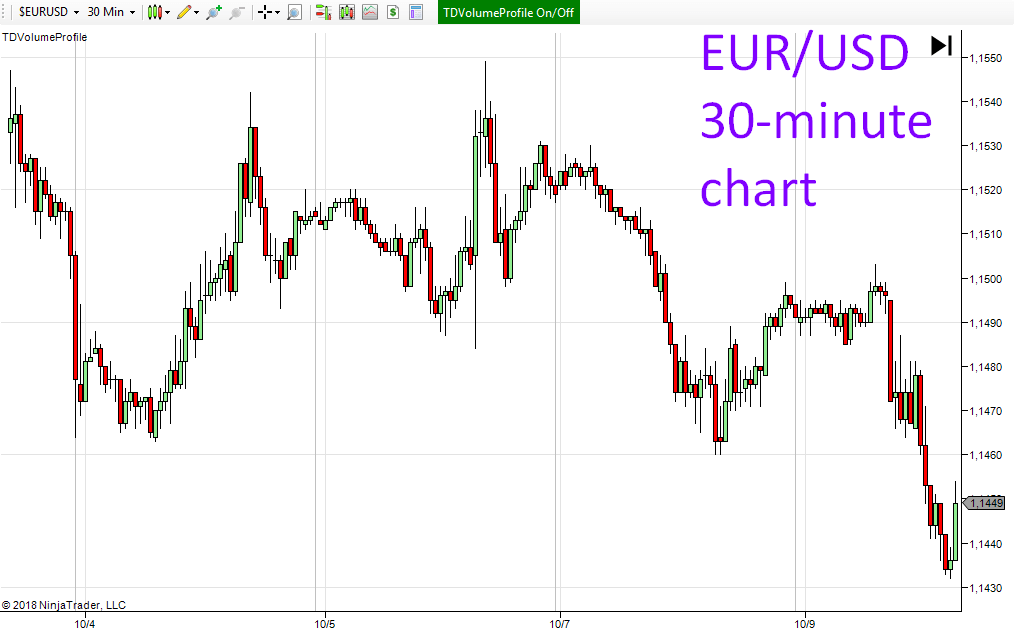
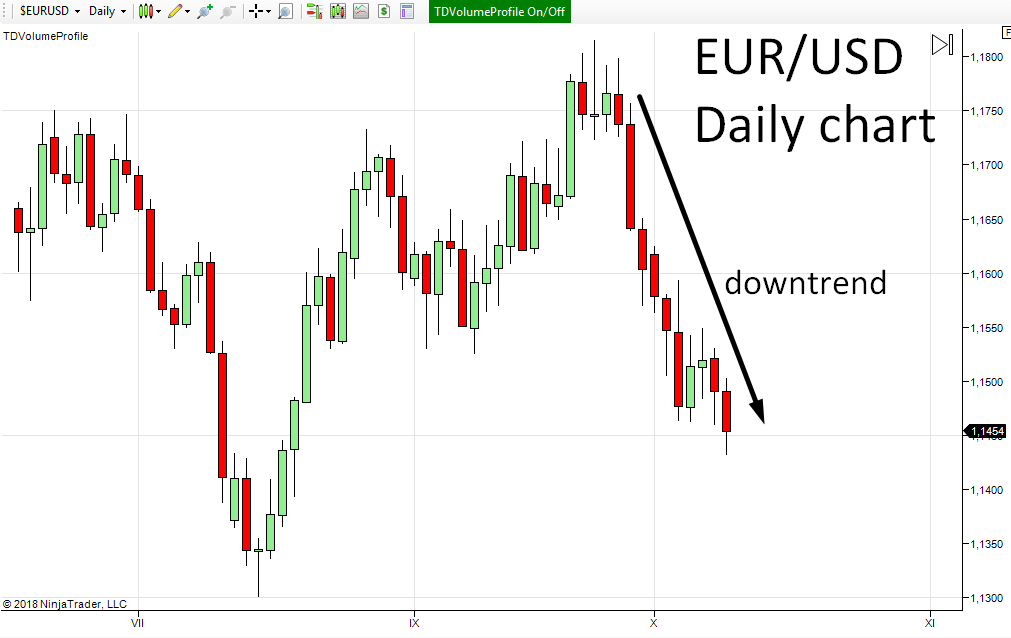
Even if you are trading intraday trades, you should be aware of what is happening on the higher time frames. I suggest that you check 4-hour or 1-day charts every day or so to see what the overall development is. Below, there are two pictures. The first one shows a 30-minute time frame from which you can't really see the overall trend. The picture below that shows a Daily time frame of the same instrument. There, you can see pretty clearly what the current trend is.What is the benefit of this? Simply put, seeing the bigger picture tells you if it is better to look for long trades or for short trades. Currently, I favorize shorts on the EUR/USD, because the pair is in a downtrend (from the Daily time frame point of view).
Volumes on Higher Time Frames
If you watched my Volume Profile webinar or read my Volume Profile book, then you know how to use the Flexible Profile. You also know what the important areas to analyze with this tool are. It usually comes down to analyzing just a part of the chart/or of the trading day (for example 10-30 30-minute candles).However, it is also important to know how the volumes were distributed throughout a longer period of time - for example, a whole week. I personally always look at a Weekly profile, even when I am looking for intraday levels. Why? Because the weekly profile shows me the bigger picture and the best trading levels are usually those, that are also visible on the weekly/accumulative profile (= bigger picture).
TIP: Don't know how to create a Weekly profile? Simply stretch the Flexible Profile over the last 5 trading days (or from Monday to the current day of the week). If the price moves away from the current week's range, it is also good to view the previous week's volumes. Despite they are a bit older, the price is likely to react on those volumes too.
Relevant Time Frames for Swing Trading
Swing trades are trades that you hold open usually for several days. They last roughly from 1 day to 1 month. A typical range for such trade is somewhere between 30 pips to 200 pips. This is obviously a very rough number. It varies dramatically depending on the trading instrument you trade.Significant swing levels should be visible on higher time frames. If they aren't, then they are not so significant. If you are trading my volume-based strategies, then you should be analyzing charts in time frames around 4-hour to 1-week. I personally prefer 1-day charts for my swings.
Just pick any time frame from this higher range and start looking for the significant Price Action places (Price channel/rotation, the Trend and the Aggressive rejection). Then apply the Flexible Profile to those places, and it will point you to the best trading levels.
The Bigger Picture (in Swing trading)
Price on higher time frames
I don't usually go to higher time frames than Daily when I am looking for Swing trade levels. The reason is that I think that the Daily candles which I use in my swing trading are big time frame enough. With the Daily time frame, you can see the overall (weekly, monthly) trend even if you don't watch the weekly or monthly charts (provided you have a normal size screen and not just a tiny one).Watching Weekly or Monthly charts as an addition to your swing analysis on 4-hour or 1-Day charts doesn't hurt. Still, it is not entirely necessary. At least in my opinion.
Volumes on higher Time Frames
With the Swing trades, I like to look at the bigger picture using cumulative or a Yearly Volume Profile. I look at the current year's profile, and sometimes also at the profile from the previous year (if the current yearly profile is not fully developed yet- there are only a few months). This gives me a nice overall view of the most important swing trade zones. The ideal swing level is when it is in line with strong volume zone on the Yearly (or cumulative) profile.Below is a Daily chart of USD/CHF. There is the Volume accumulation setup visible on the right side of the chart. This alone is a strong swing level to go short from. Additionally, the level is also placed in strong volume zone visible on the cumulative Profile (last 12 months). That's the ideal trade scenario.
*Don't know how to create a Yearly or a cumulative profile? Then use the Flexible Volume Profile and stretch it over the whole current year to get the Yearly Profile. If there are only a few months in the current year, then you want to stretch the Flexible Profile over a larger area - for example the last 5-12 months ( = this is the cumulative Profile).
Position Management
As far as the time frame for your position management is concerned, there is a pretty simple rule of thumb to follow. The rule is: Always manage your trade on the same time frame you created your trading level.I found out that many traders get scared when they are in a trade, and there is a resistance standing in the way of their trade. It is absolutely okay to quit your trade when it hits a resistance. It is usually better than to take the risk and possibly turn from green numbers to the red. However, to quit your trade like this, the resistance needs to be visible on the same time frame you used to create your level. This means that the "strength" of the resistance can match the strength of your level. Let me give you a crazy extreme example to demonstrate this:
Example
Imagine you are in a swing position, which is based on a level created using Daily candles. When you are in the trade, you switch time frame from 1-Day to 1-Minute. Now, on the 1-Minute chart, you notice a resistance standing in your way! So you quit your trade. This is obviously a mistake! Why would you quit a trade based on a strong Daily signal just because of a tiny resistance level created on the 1-minute chart?This is obviously an exaggerated example. Still, traders often quit good trades based on strong levels just because they get scared by some minor resistance on lower time frames.
Remember: if you created your trading level on the Daily time frame, then you can quit the trade only on a resistance which is also formed on a Daily time frame (or on your predetermined Profit Target, of course).
If you are trading Intraday trades and you did your analysis on the 30-minute time frame, then don't quit because something on 1-minute time frame scared you. You can quit the trade only if there is a resistance from 30-minute time frame standing in your way.
There will always be some resistance in your way. Sometimes weaker, sometimes stronger. In order to make a profit, you need to hold your positions through the weaker ones.
Summary:
- If you trade volume setups, it is not so crucial what EXACT time frame you chose. Only make sure you are in the proper time frame range.
- Look into higher time frames to see how the overall trend goes.
- Use cumulative (or higher time frame) Volume Profile to see how volumes were distributed over the longer time period.
- Manage your positions on the same time frame you used to create your trading levels.
Happy trading
-Dale
P.S. – If you would like my Daily and Swing Levels so that you can start ‘Earning While You Learn,’ then check out our Advanced Volume Profile Training Course and Members Forum for more information – Click Here to Start Learning Now
P.P.S. I have just released a new book: VOLUME PROFILE: The insider’s guide to trading. I put a ton of work into it and I am sure it will prove extremely helpful to you. Go and get your copy HERE. I guarantee you that this will be the best $4.99 you ever spent.
Comments
Post a Comment