I know it may sound weird to do cryptocurrency analysis with volume profile but in fact, I don’t really see a better way. The whole logic behind volume profile trading is to track big institutions and large financial institutions who move and manipulate the markets. Do you think crypto markets are any different? Well, they were different when they were perceived as a “curious hobby of a few IT enthusiasts” a few years back. However, everything is different now, and big financial groups have a major share in the cryptocurrency market. To say it bluntly: the game few IT enthusiasts played is no longer THEIR game. Now the big guys are playing it and they are the ones to make the rules, the moves, and all the manipulations. One picture is worth a thousand words, right? So, have a look at the picture below to see how many people own the majority of the biggest cryptocurrency (according to market capitalization) – Bitcoin.
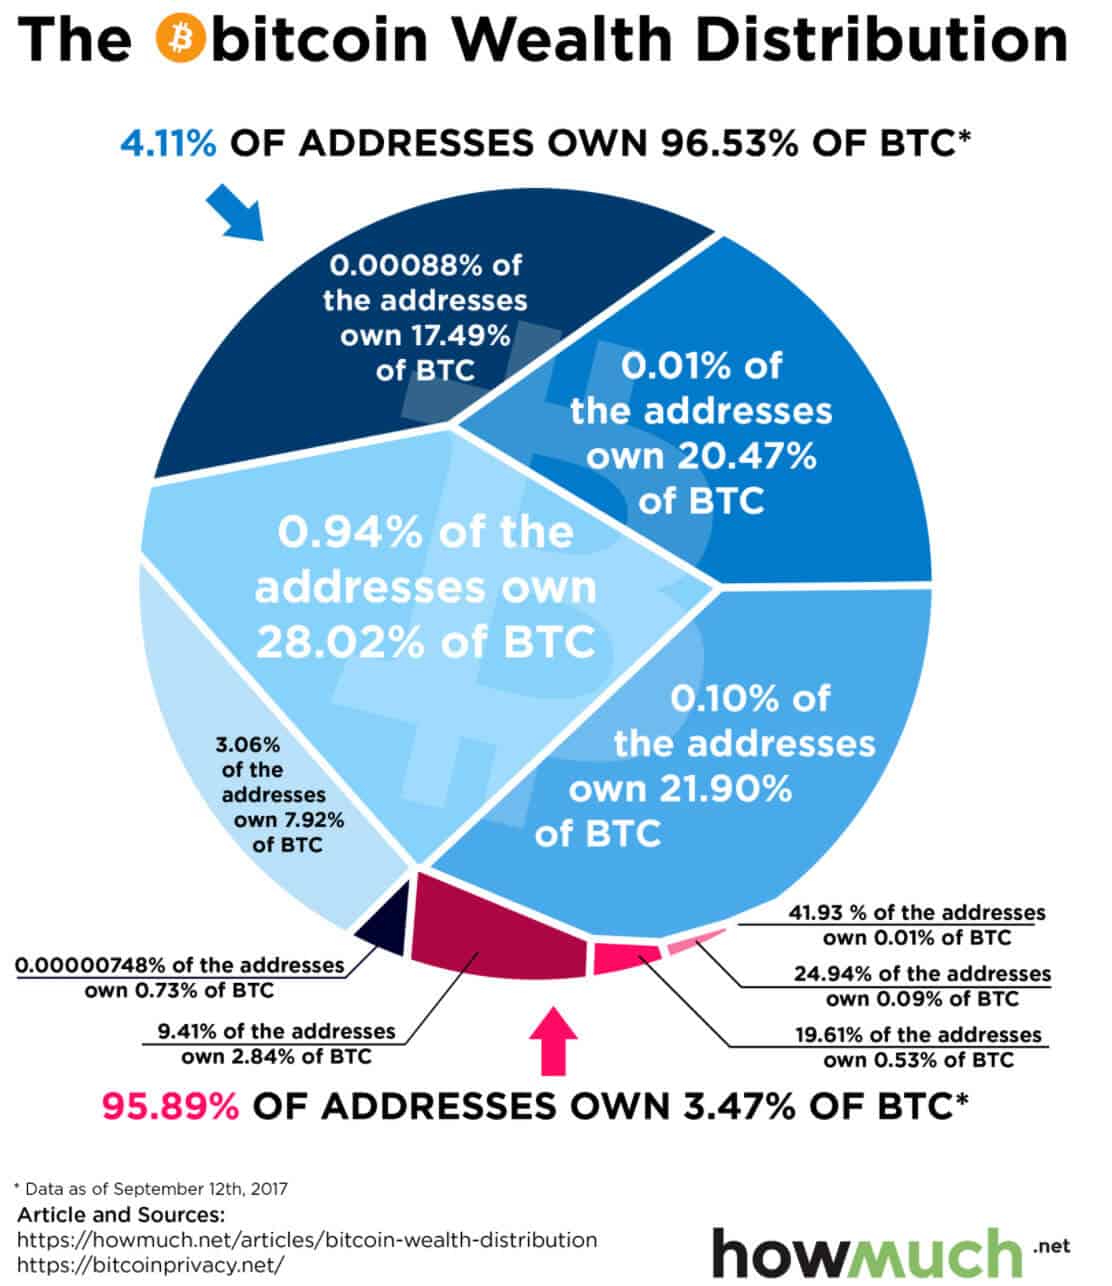
In the picture, you can see that an overwhelming majority of Bitcoins are owned by only a very few “addresses” (in this case large financial groups). At the bottom of the picture, you can see a small little share that the retail traders own (that’s us). It is the same for currencies, major cryptocurrencies, stocks, indexes…the market is ALWAYS dominated, moved, and manipulated by a few big institutions or financial groups. That’s why volume analysis is the best way to analyze the market and to identify the strongest support and resistance zones.
In this article, I would like to show you how you can analyze Bitcoin (or any other cryptocurrency) using the volume profile.
The good news is that you can do it in essentially the same way as with any other trading instrument. This is the advantage of volume-based trading strategies.
Let’s now have a look at a few examples of intraday trades.
Intraday Trades
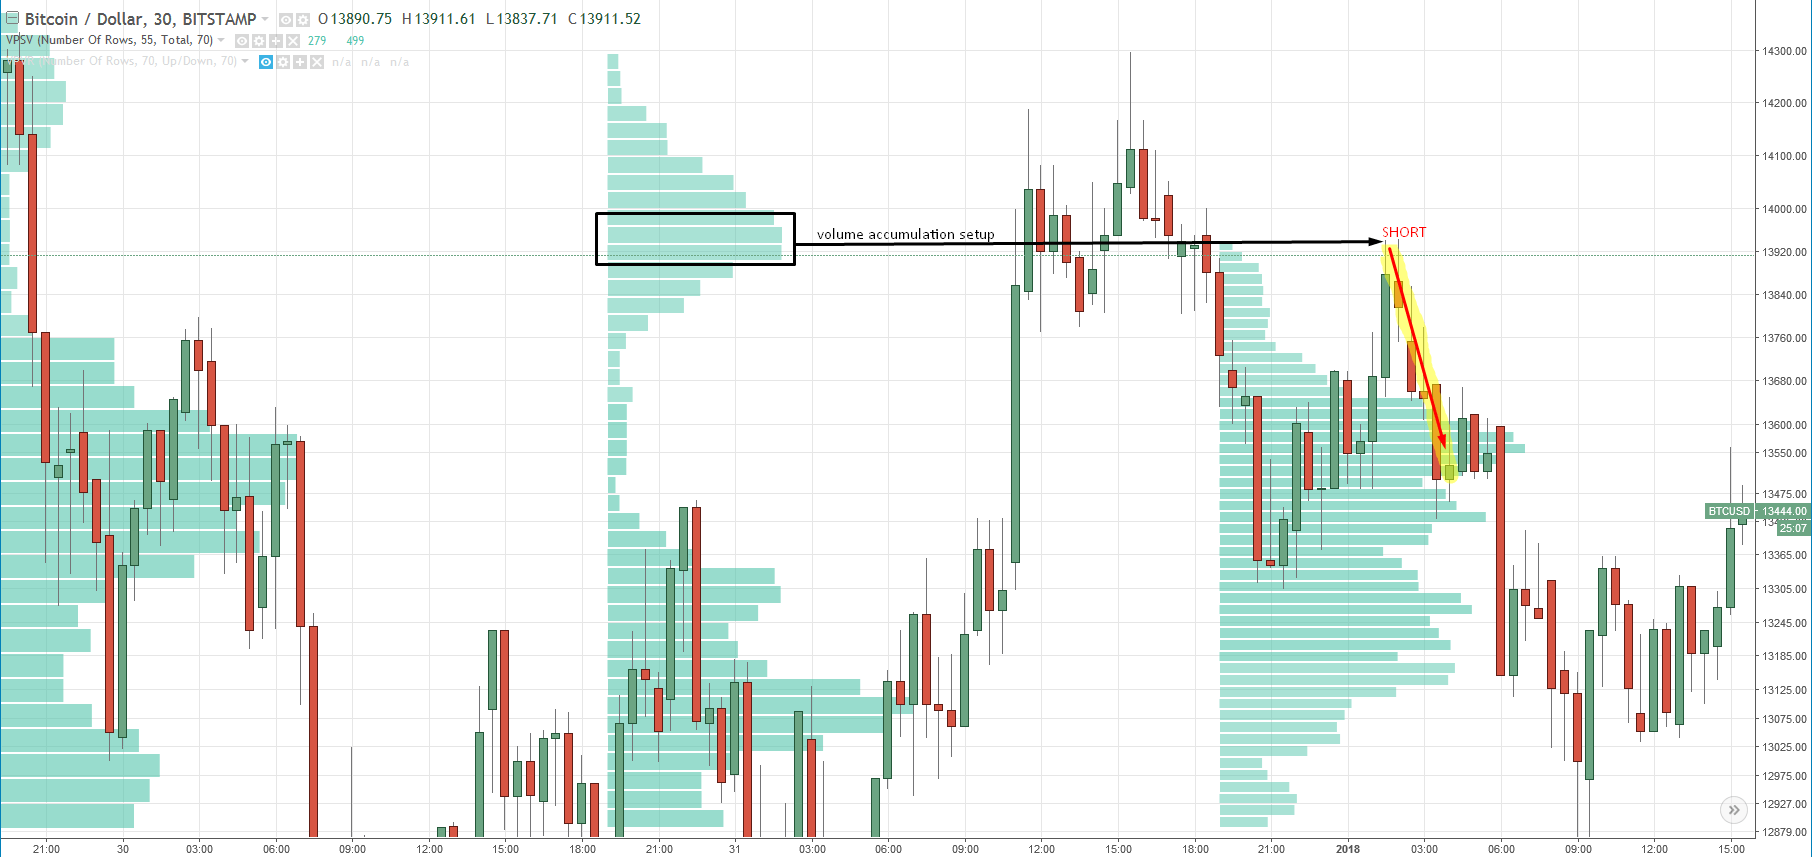
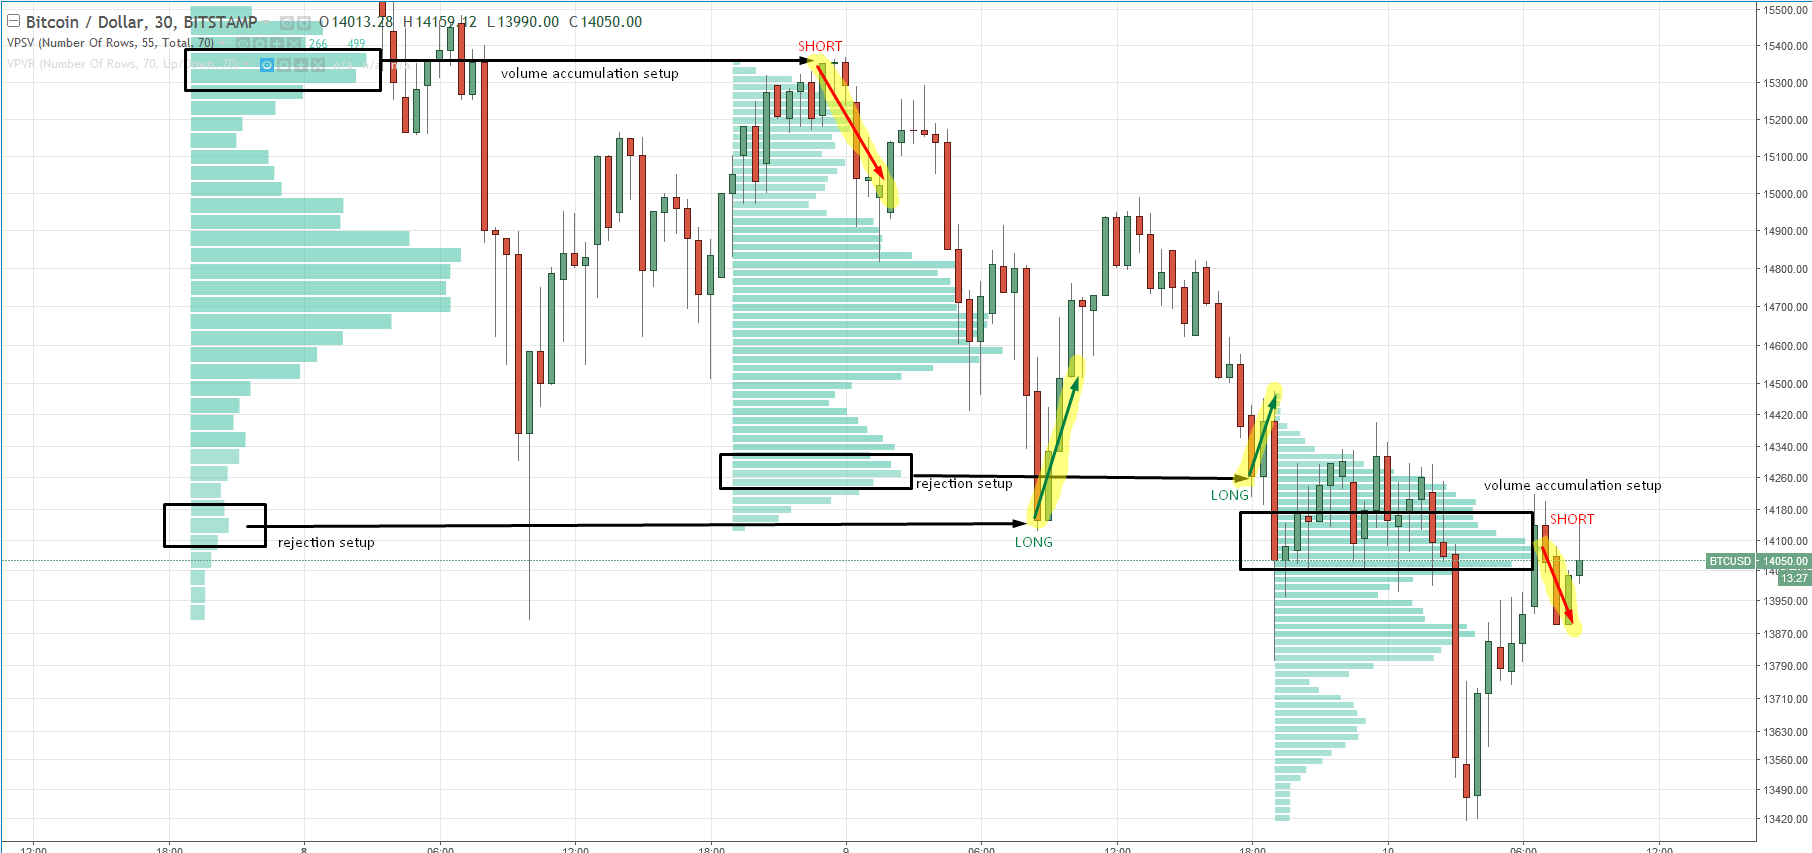
*(30-minute timeframe, Daily volume profiles)This trade is a nice example of a volume accumulation trading strategy. On the daily profile, on the left side, you can see a strong volume accumulation area. After big players placed their positions there, they started further aggressive selling activity, thus pushing the price lower. When the price returned to this area again, those who were initially selling in the $13,920 zone started aggressive selling again as there were before. This aggressive selling causes the price to fall.
Another example is based on the Rejection setup. You can see that the price made a sharp and aggressive reversal around 09:00 (the “pinbar”). In the rectangular area that I marked on the profile, you can see a volume cluster. This volume cluster indicates strong and aggressive buyers who were rejecting lower prices aggressively and pushing the price upwards. Those strong buyers became active again when the price came back into this level later, and prices thus moved higher.

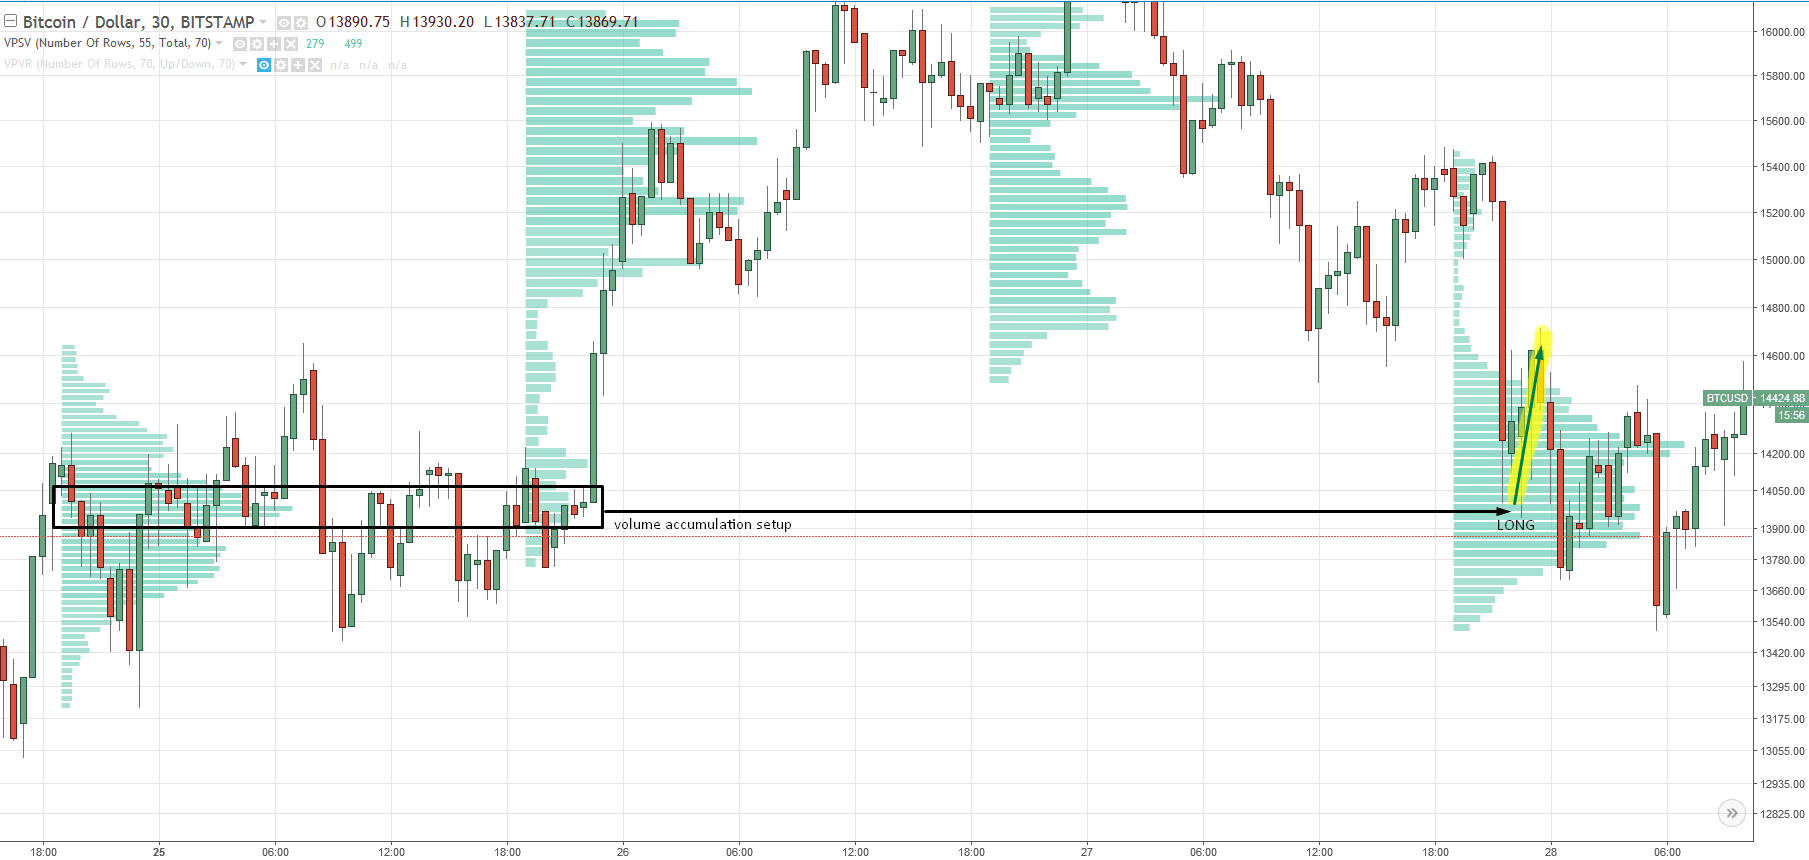
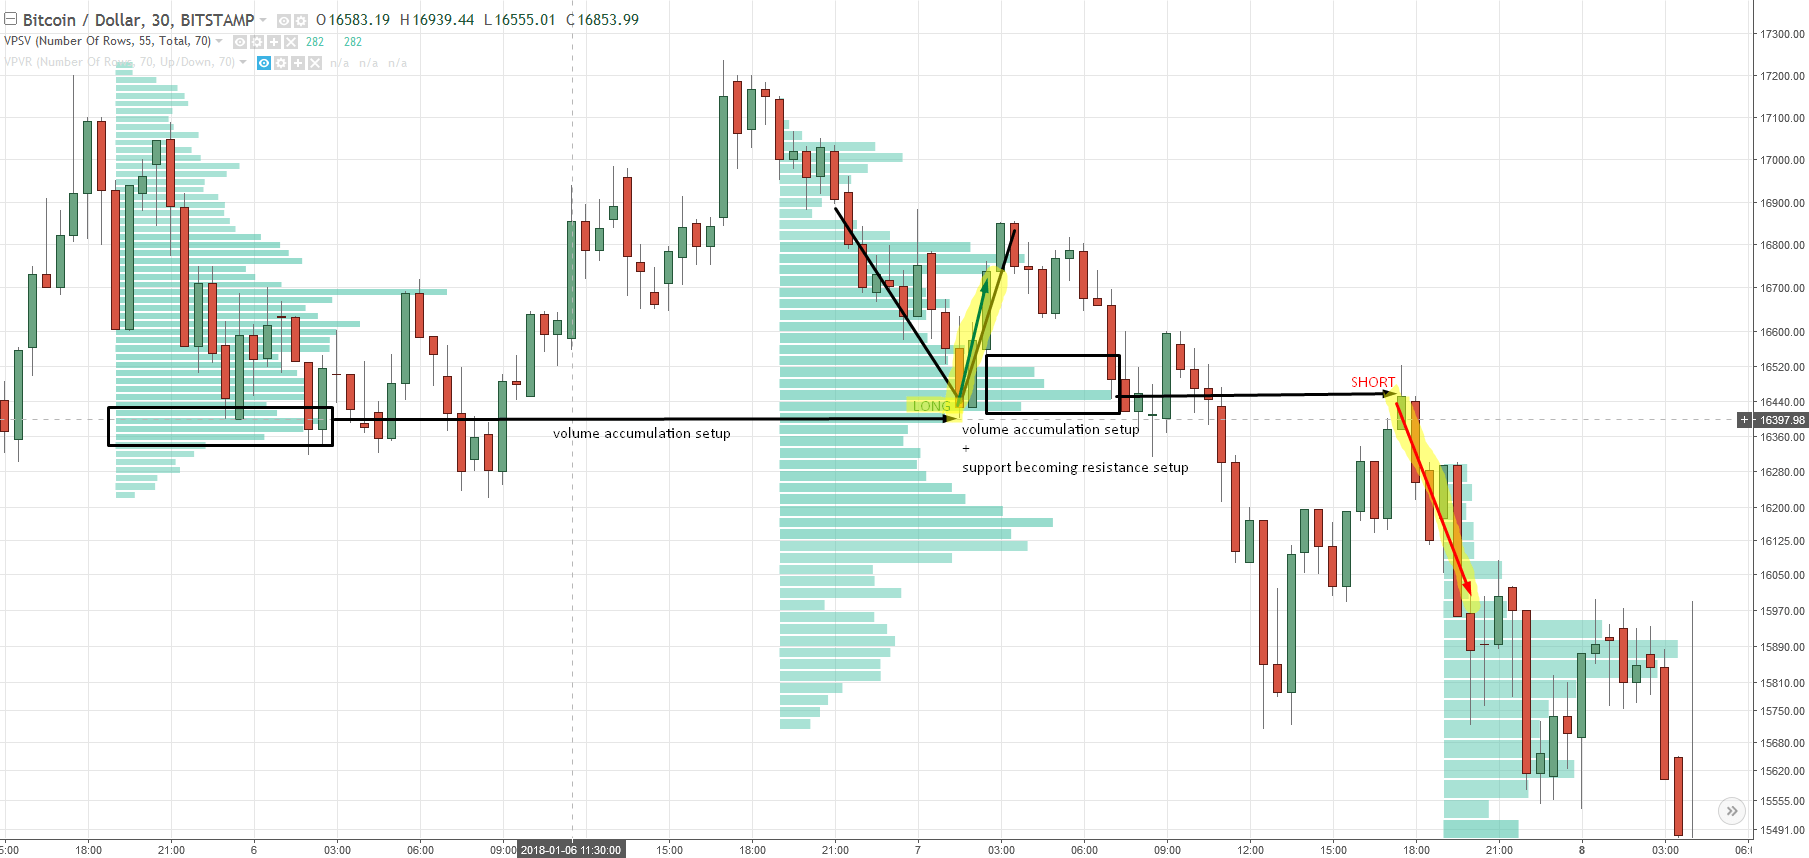
The next example is based on the volume accumulation setup. In this case, the volume accumulation took quite a lot of time, roughly one whole day. On the left side of the chart, you can see a “D” shaped profile (volume accumulation). After that, there was strong buying activity that started right at the Point of Control. A place like this is usually pretty significant and it marks a strong support zone. You can see that even after three days, the reaction to the Point of Control was really precise.
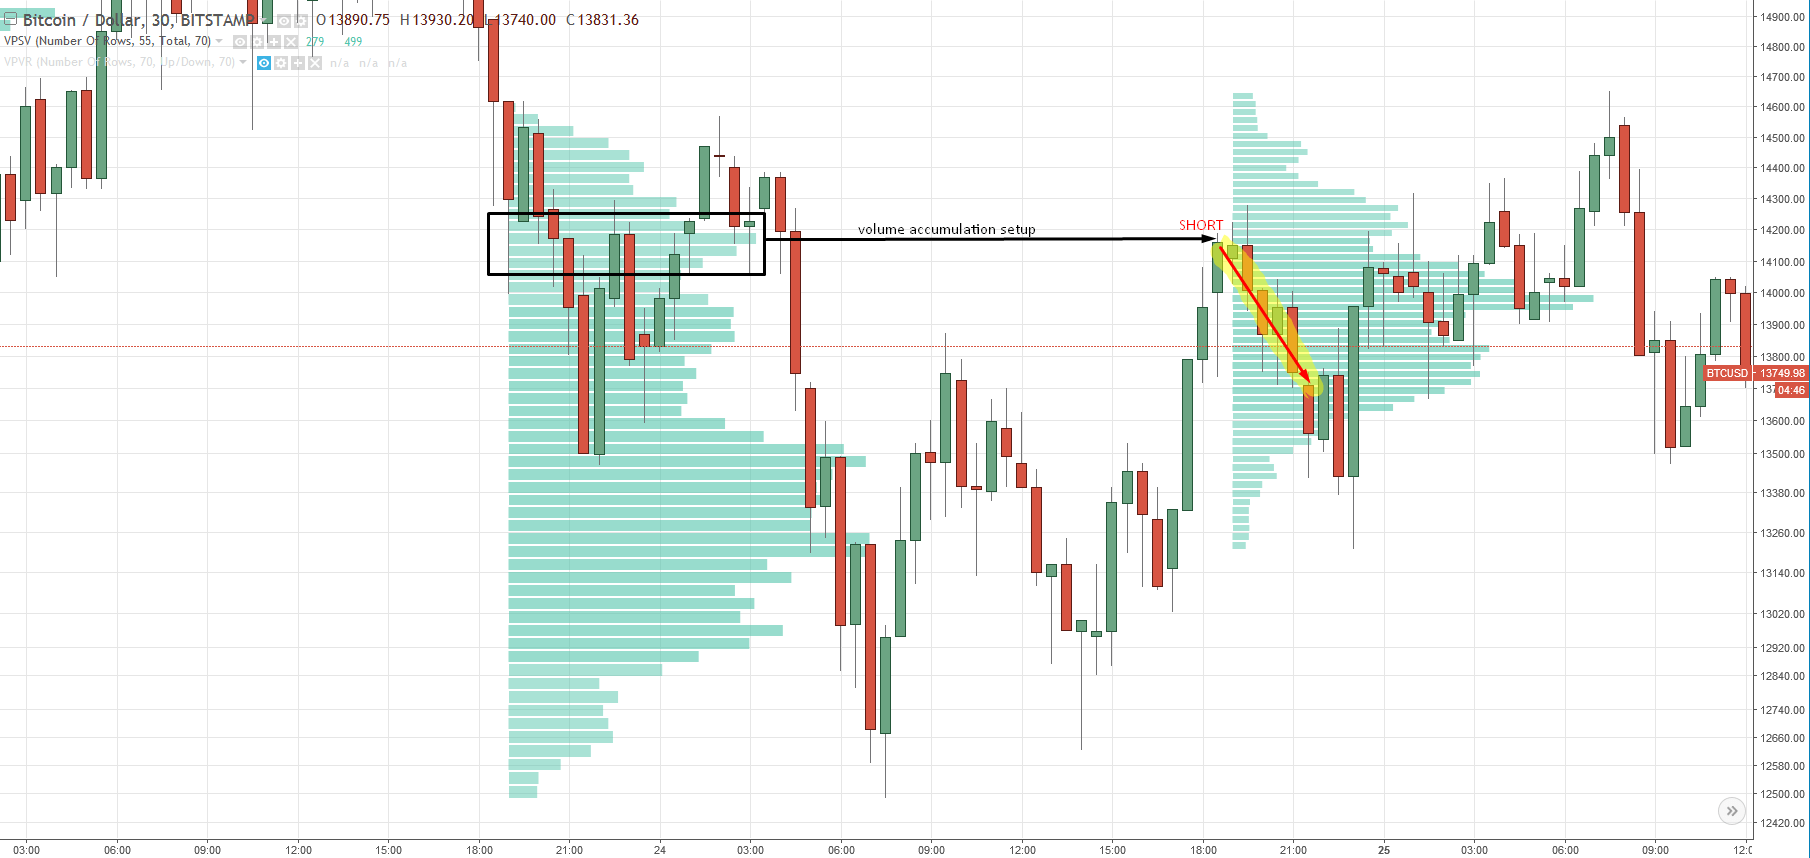
The next example shows another volume accumulation setup. This time the volume accumulation phase took only three hours. Again, you can see that even though most may think that Bitcoin is volatile and unpredictable, the reactions to significant volume-based S/R zones are undeniably precise.
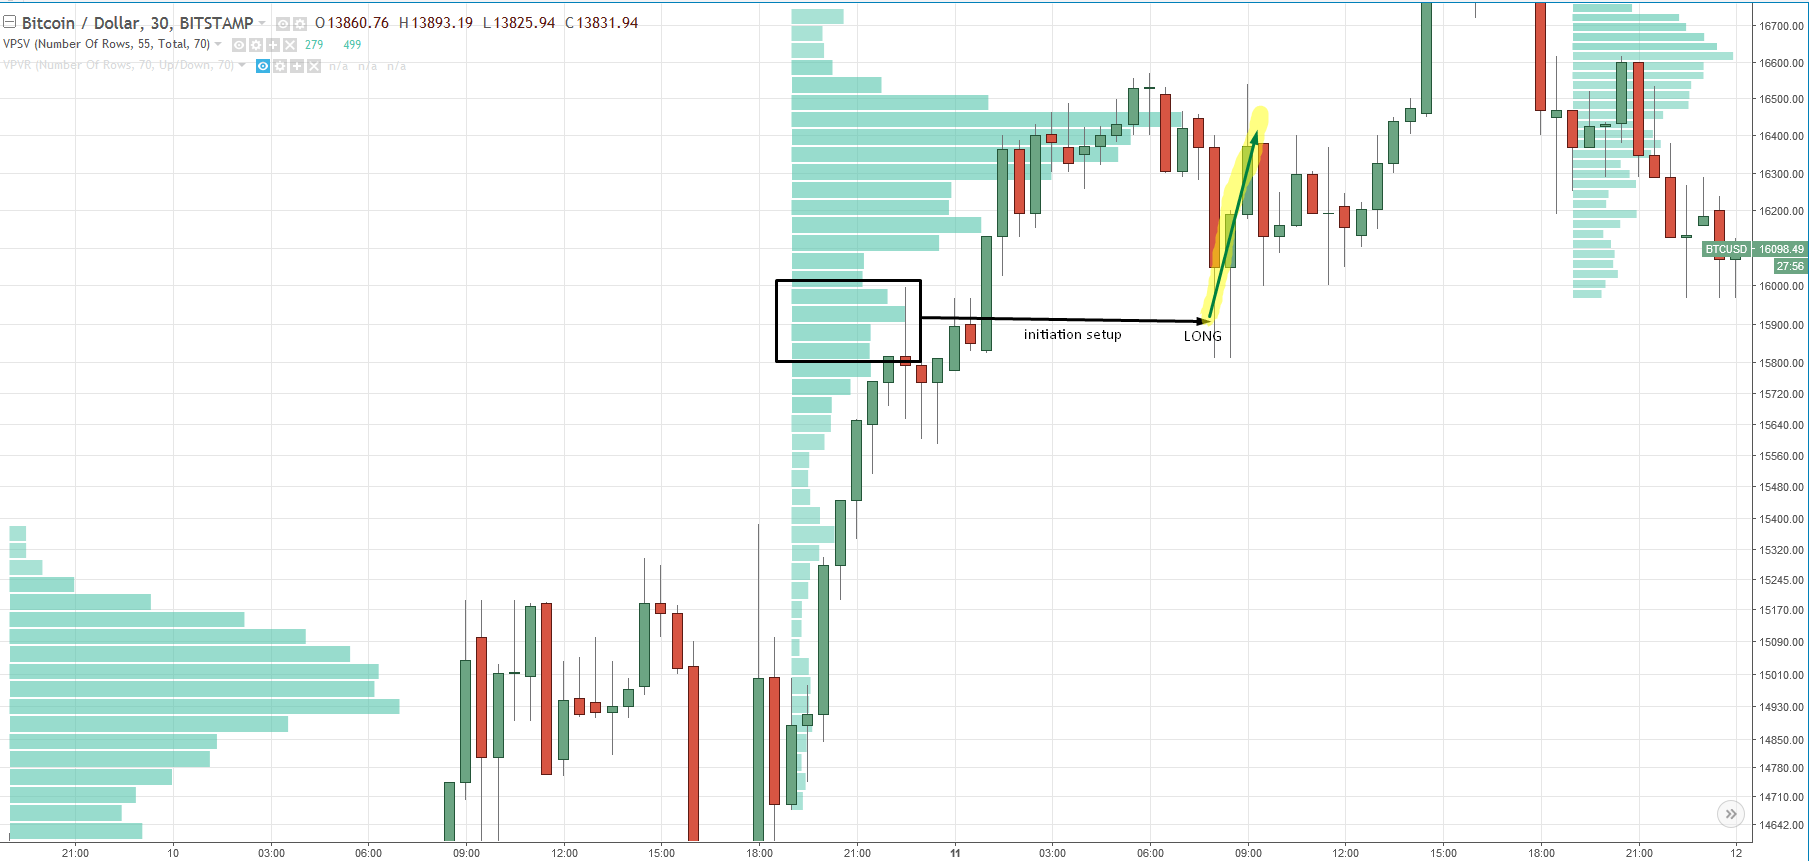
My next example is based on the Initiation setup. I use this setup when there is a strong trending move. Basically, I wait for a significant volume cluster to form and then I wait for a pullback into this area. I enter the trade in the direction of the trend from the place where the volume cluster is the “thickest” – where most of the volumes appeared through the previous move.
Have a look at two more pictures with some nice intra-day trading opportunities, then I will move to swing trades.
Swing Trading Cryptocurrency
* (4-hour timeframe, Flexible volume profiles)I understand that intraday trading bitcoin or any other cryptocurrency is quite difficult. This is compounded by the wider spreads that brokers offer for those type of instruments. The reason brokers often have wider spreads for those instruments is that cryptocurrencies can be extremely volatile and can produce massive and often unexpected moves. To offset the risk, brokers often pad the spread beyond actual market conditions. The other reason is that cryptocurrencies are new and in most cases not as liquid as other instruments. Finally, and depending on the business model of the broker, they can make a significant amount of money from trading newbies who suddenly decide to trade bitcoin or other cryptocurrencies without the proper trading education. New traders are easy prey for the brokers who gut them with wide spreads, knowing retail traders almost always over trade.
Swing trading is a nice way to trade cryptocurrencies as it combats higher spreads. Swing trading looks for larger profit targets and thus spread is a much smaller portion of your stop loss or take profit.
The good news is that you can trade with the same volume-based trade setups that I showed you. I.e. the volume accumulation setup, the initiation setup, and the rejection setup. In my examples, I used 4-hour charts as well as Flexible Volume Profile Indicator that made it possible to analyze only the parts of the chart I was interested in.
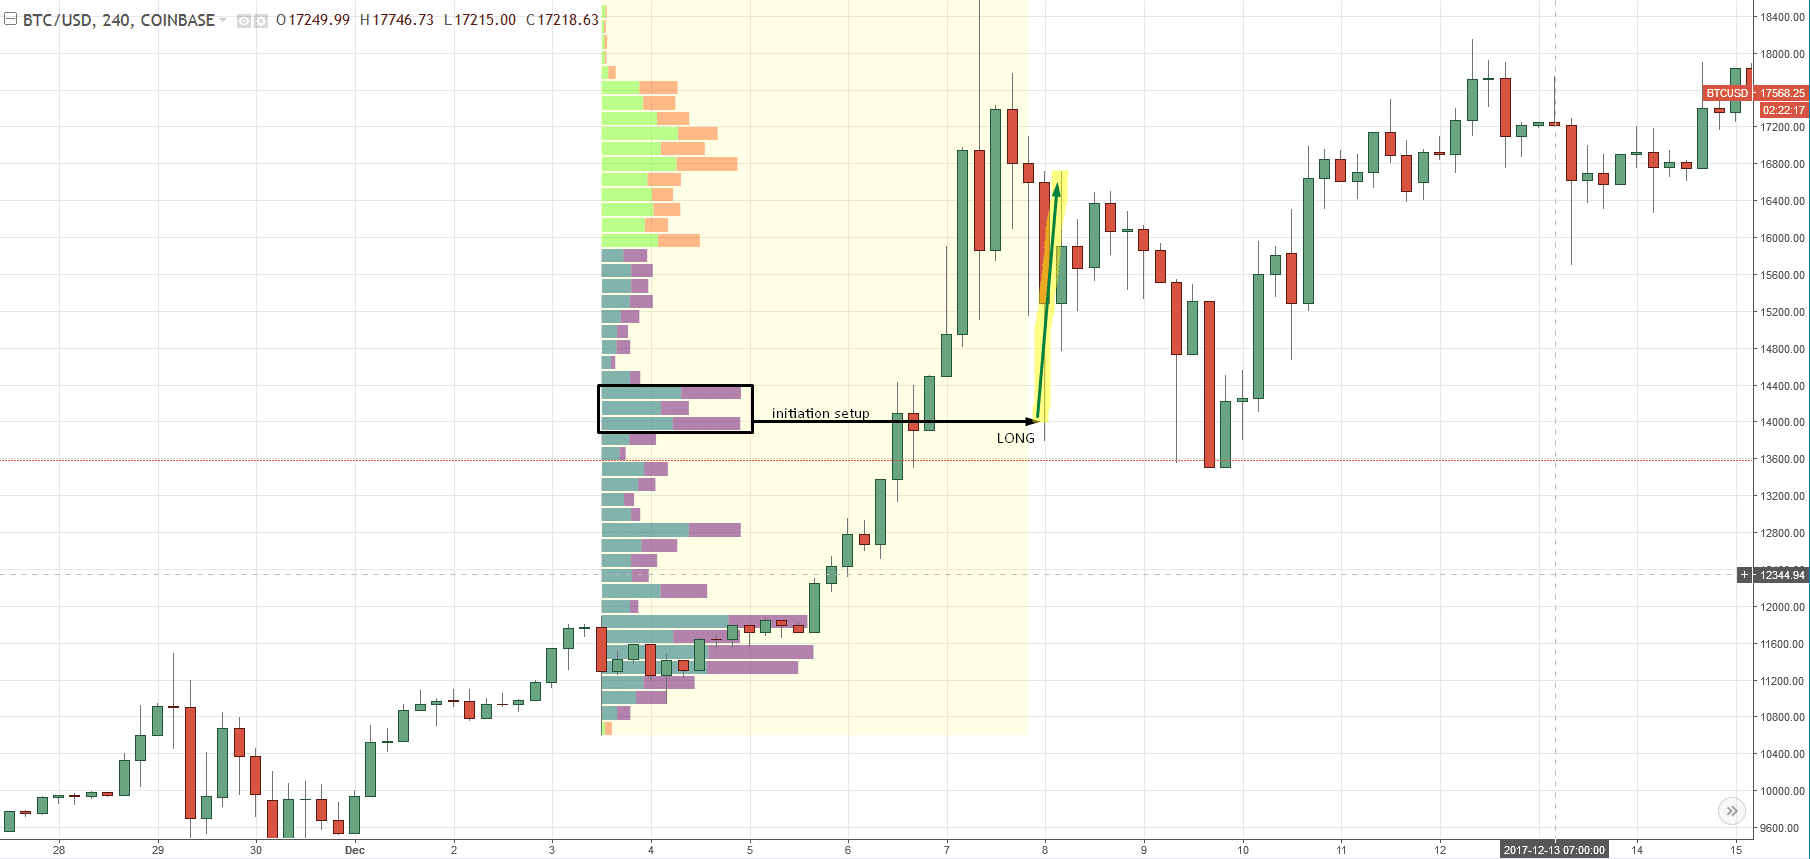
The first example shows buying momentum on BTC/USD that took place quite recently. Within this strong uptrend, you can see a pretty significant volume cluster. This volume cluster indicates strong buyers who were adding to their buying positions there before pushing the price even higher. In a case like this, I wait for a pullback to this area and enter the trade in the direction of the trend. In this example, it was a long trade.
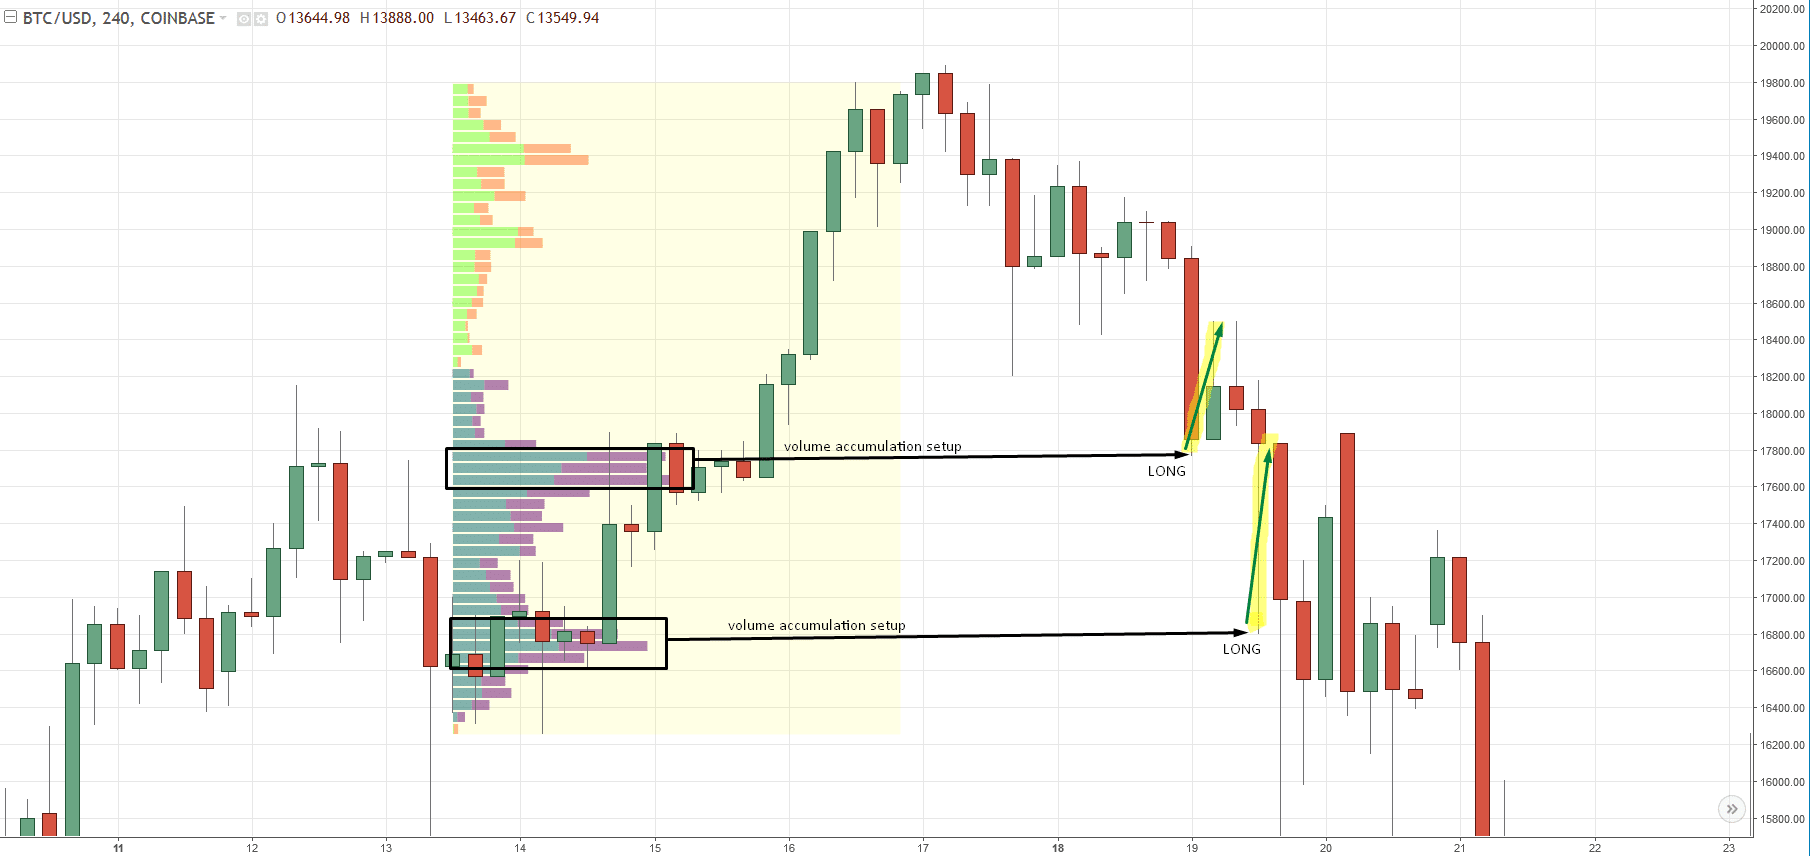
Below you can see another nice example of Bitcoin reacting to a strong volume areas. In both cases, the entry is based on my favorite volume accumulation setup.
The Best Cryptocurrencies To Trade
Usually, it is not very easy to choose which trading instruments you will follow and trade (unfortunately you can’t trade them all). If you were to chose solely from cryptocurrencies I suggest you focus only on the most liquid – the ones with the biggest market capitalization. Big market capitalization means good liquidity, better spreads and a smaller chance of slippage. The absolute winner is obviously Bitcoin. Other ones that follow are for example Ethereum or Ripple. Below, you can see a table with the ten cryptocurrencies based on Market Cap.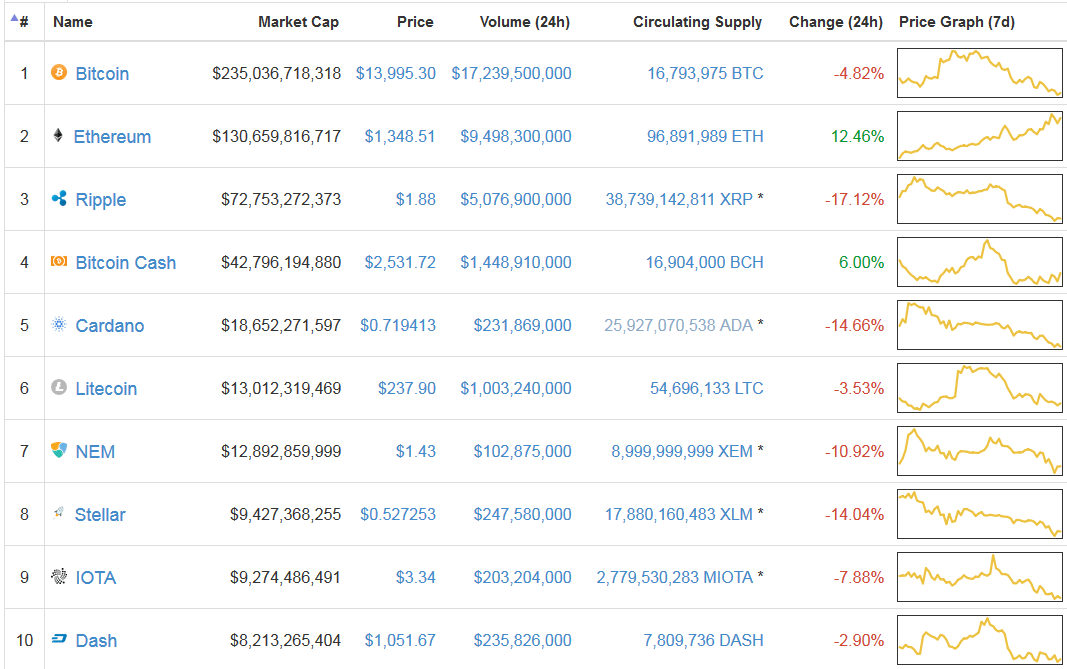 Cryptocurrency market is obviously pretty young so this table is liable to change continuously. You can see the up-to-date version here: Cryptocurrency Market Capitalization
Another thing you should consider is volatility. You need the market to move in order to make money. Instruments that go sideways many days, then jump suddenly and then go sideways again really aren’t ideal for trading. At least not for intraday or swing trades.
Trading Strategies
If the three strategies I showed you in this article weren’t clear enough, you can check out the three short videos below. Each video explains 1 of the volume profile setups discussed earlier in the article. The concept is the same both for intraday and for swing trading:**If you made it through the whole article, then I have a small BONUS TIP for you. If you are new to cryptocurrencies and you would like to do Intraday trading or Swing trading with cryptos, then start with Bitcoin. I personally had the best results with this particular instrument. It has very consistent reactions to volume-based support/resistance zones, and it is a good place to start. After you feel comfortable with that, you can move on to trading other cryptocurrencies.
P.S – If you would like my Daily Levels so that you can start ‘Earning While You Learn,’ then check out our Advanced Volume Profile Training Course and Members Forum for more information – Click Here to Start Learning Now
Happy trading,
-Dale
Thanks for sharing valuable information
ReplyDeleteShriram Transport Finance Co. Ltd
Oberoi Realty Ltd