
Hello guys,
in today’s day-trading analysis I would like to have a closer look at CAD/CHF.
Yesterday, there was a tight rotation, and then the price broke out and went upwards into a new trend.
What usually happens in such cases is that BIG trading institutions accumulate their huge trading positions (enter trades) in a rotation and then they push (manipulate) the price to shoot into a trend.
Those BIG guys need to hide their intentions and that’s why they need to accumulate their trading positions slowly and unnoticed (without starting a trend too soon). That’s why they accumulate those trades within a rotation.
Just like the one on the picture below.
When I see a rotation followed by a trend I am always interested in how the volumes were distributed throughout this area. What I want to see is a heavy volume zone in the rotation (at the place from which the trend starts).
For this, I use my Flexible Volume Profile. This tool helps me to easily read the market and reveal this big institutional volumes.
CAD/CHF, 30 Minute chart:
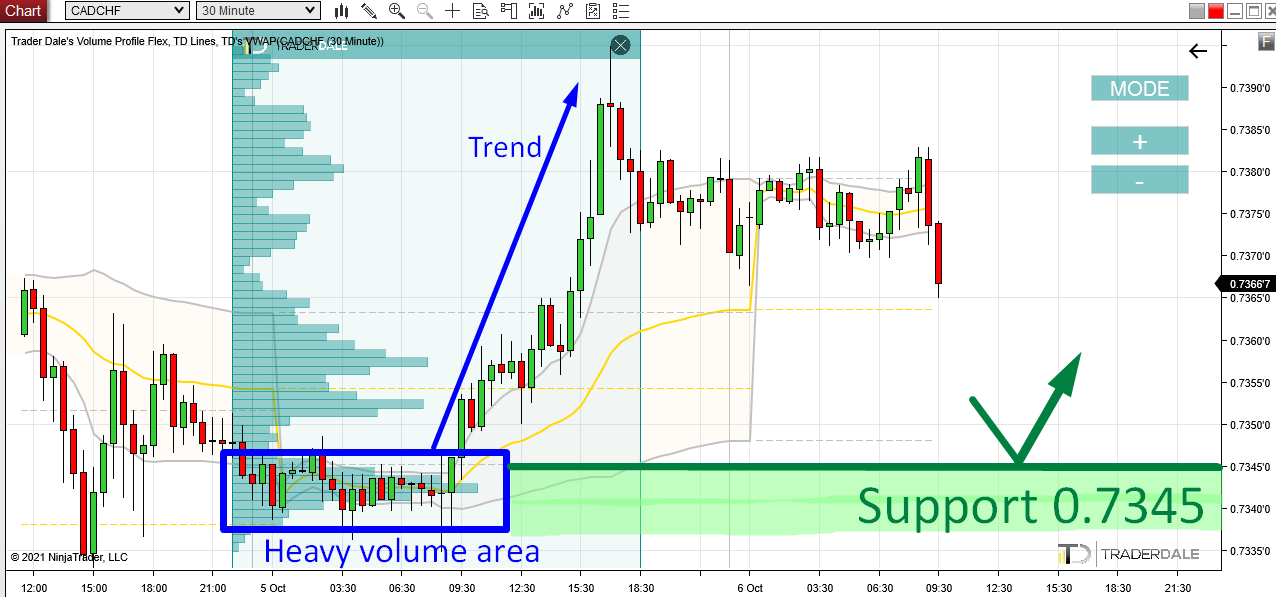
What the picture above is telling me is this: there was a rotation area where heavy volumes were accumulated (traded). Those were most likely BIG institutional traders accumulating their Longs. When they were finished with the accumulation, they started to push the price aggressively upwards (they do it with aggressive Market Orders).
What now?
When the price makes it back into this heavy volume zone (starting at 0.7345) then I think the strong Buyers will want to become active here again. This zone is clearly important for them as they placed a lot of their trades there.
I expect they will want to defend this zone and push the price upwards from here again.
This should make this zone (starting at 0.7345) a strong day-trading Support.
The Setup i used here is called the “Volume Accumulation Setup” and you can learn all there is about it in my Trading Course.
Do you want ME to help YOU with your trading?
VWAP Trading Setup
Apart from the Volume Profile setup, there is also one more thing that i like and that adds strength to our Support.
It is a VWAP setup.
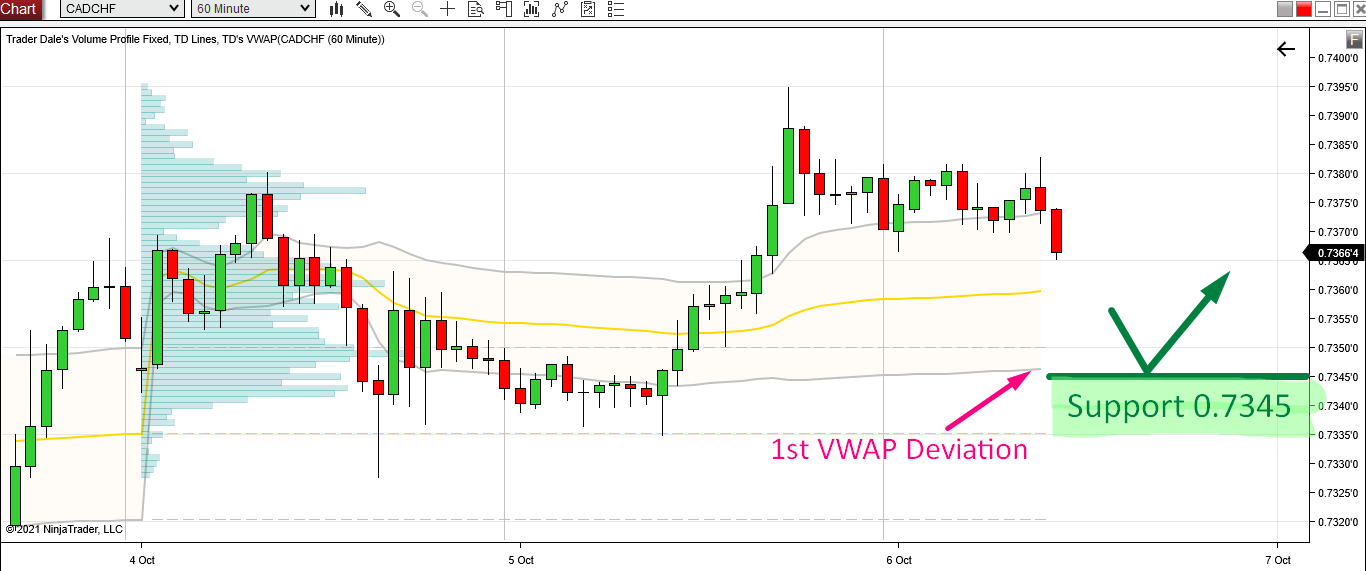
If you look at the picture below, you can see three lines. The yellow one is VWAP, and the two grey ones are 1st deviations of VWAP.
Those tend to work as Support/Resistance zones (especially when combined with Volume Profile Setups).
Currently, the lower 1st deviation is at our Support (0.7345). This means than not only Volume Profile is telling us that there is a Support, but also VWAP 1st Deviation confirms it.
CAD/CHF, 60 Minute chart, Weekly VWAP:
What I like about this is the confluence of two independent trading setups. I am always looking out for these as they give very strong trading signals.
If you would like to learn more about VWAP, then you can check out recording of a VWAP webinar here:
I hope you guys liked my analysis! Let me know what you think in the comments below!
Happy trading,
-Dale
- Get link
- Other Apps
- Get link
- Other Apps
Comments
Post a Comment