
AUD/CHF: Volume Profile And Price Action Analysis


Hello guys,

today’s day trading analysis will be on AUD/CHF. But before we start here is some news for you:

Recently, I made a private Volume Profile webinar. You won’t find it available for public on YouTube or anywhere else, but you can get to it by clicking the gray  banner at the top right of this page (saying Volume Profile Webinar, Watch Now). Enjoy!

Let’s get to the AUD/CHF analysis now!

A Rotation And A Trend

One of the first things I look for when going through the charts each morning is a “formation” where a rotation (price channel) breaks out into a new trend.

A rotation usually means heavy volumes. The reason is that the BIG trading institutions usually accumulate their trades in a rotation.

A trend that follows after a rotation is telling us that those BIG guys have entered their trades and are now manipulating the price to move.

This is quite a valuable piece of information because it tells us where the institutions were entering their trades – in other words: which place is important for them (rotation zones). And it also tells us whether those BIG guys were Sellers or Buyers (Uptrend = Buyers, Downtrend = Sellers).

In this case, it seems, that strong Sellers were building up their Short positions in the area around 0.6788 and then they manipulated the price to go downwards.

Volume Profile

What makes identifying the BIG guys easy is the Volume Profile indicator. If you look at it, then it tells you right away where the most important activity in the chart was.

In the picture below, you can see the heavy volume area clearly stand out. This confirms that the heaviest volumes were accumulated in the rotation around 0.6788.

AUD/CHF, 30 Minute chart:

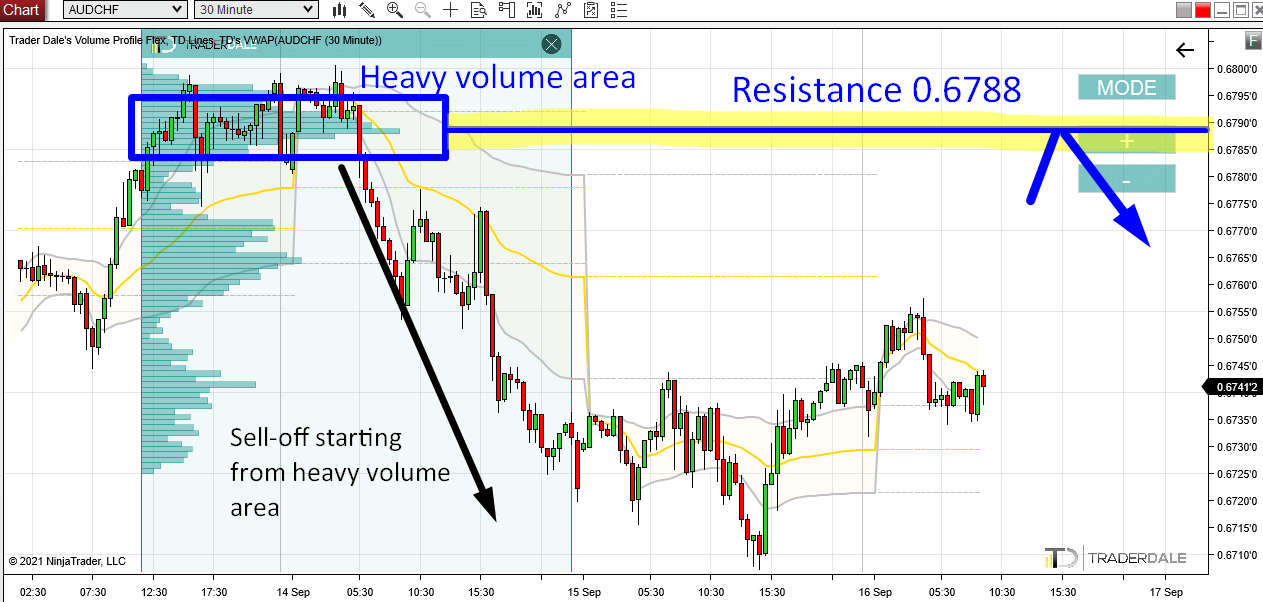
The picture above clearly shows that there was an important institutional zone around 0.6788.

Wait For A Pullback

When the price makes it back into this zone again, then it is quite likely that the BIG institutional traders who placed their Shorts there will want to enter new Shorts in this area and manipulate the price downwards again. Or, that they are still in their Short trades and they will want to defend them – by manipulating the price downwards.

In either case, this heavy volume zone should represent a strong Resistance and when there is a pullback to it in the future, the price should react to it.

The Volume Profile setup I used here is called the “Volume Accumulation Setup“.

I hope you guys liked my analysis! Let me know what you think in the comments below!

Happy trading,

-Dale

Comments

Popular posts from this blog

How To Trade The Point Of Control (POC)

DEFINITION: Point Of Control (= POC) is a price level at which the heaviest volumes were traded. The most important thing that the Volume Profile indicator shows is the POC. I dare say that if you used Volume Profile only for the purpose of identifying the POC, you would be a way better and trader then 99% of the retail traders. No matter what trading strategy you trade. Why do I say this? Why is POC so important? Point Of Control is so important because it shows the place where the most trading took place – where the biggest trading positions were accumulated. POC shows the BIG guys! Who accumulates those huge trading positions? The BIG guys – that’s the big financial institutions like hedge funds, pension funds, huge banks, etc… It is those BIG guys who move and manipulate the markets. It would be a huge advantage to know where they placed most of their positions, right? The good news is th

Beginners Guide to Order Flow PART 1: What Is Order Flow?

DEFINITION: Order Flow is an advanced charting software which enables you to read all trading orders that are processed in the market. It helps to track the BIG financial institutions through the trades they make. Most people get confused when they open up a chart with Order Flow for the first time. There is no shame in that. Order Flow shows so many information and it is easy to get overwhelmed and confused if you don’t know what to look for! This Beginners Guide will teach you how to understand how Order Flow works and how you can use it in your trading! In this 1st part of the Order Flow Guide I will show you around the Order Flow interface. Footprints The Order Flow does not show standard candles, but it shows FOOTPRINTS . A footprint shows not only Open, High, Low, Close (as standard candles) but it also shows orders traded in that candle. Orders can be

5 Character Traits of a Successful Trader – Tips & Tricks of the Pros!

 Maybe you are interested in trading, and you have taken the first step by researching on forex trading. You might also be currently trading but going through a tough time with your results in the markets and dealing with the recurrent autosuggestion, telling you how this journey might not be for you or you are not capable of achieving successes in this journey. It is essential to know that you are not alone in this feeling, and before you fall into the rabbit hole of depression, feeling like a failure in yet another skill you have chosen. Let me make it clear; the answer is YES, anyone can achieve success in trading , including you. It would only cost you a few character trait adjustments. Before we delve in, it is vital to point out that success in re